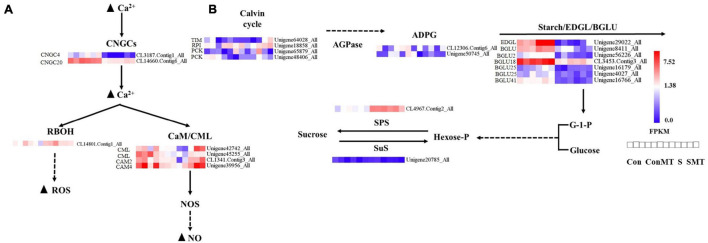
FIGURE 6.
Differentially expressed genes caused by heat stress. (A) Calcium signal transduction. (B) The metabolism of starch and sugars. The bar represents the expression (FPKM) of each gene in Con, ConMT, S, SMT as indicated by blue, white, and red squares. Blue and red represent low and high expression, respectively. Con, control; S, heat stress; SMT, heat stress with exogenous melatonin treatment; ConMT, control with exogenous melatonin treatment. More detailed information is shown in Supplementary Table 12.

