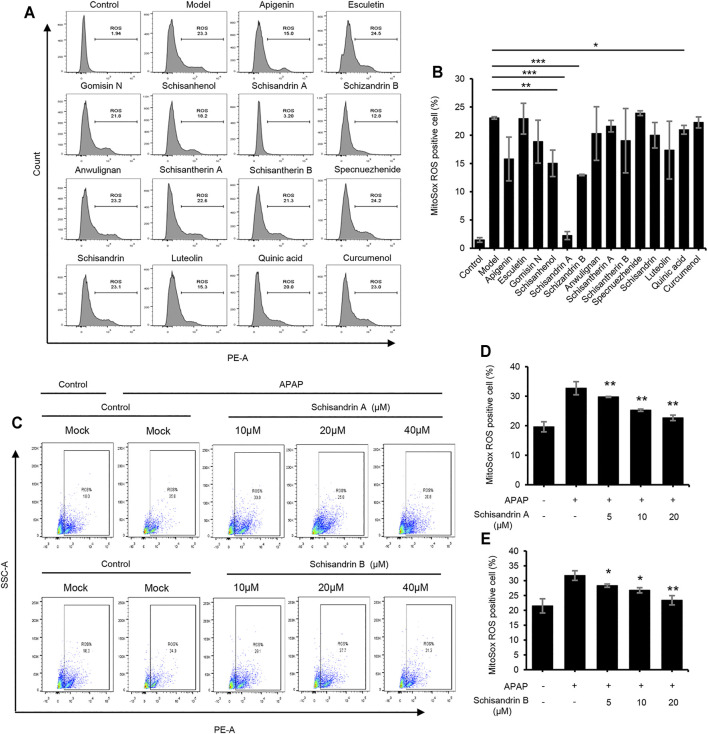
FIGURE 6.
Schisandrin A and schisandrin B inhibit the release of ROS. (A) HepaG2 cells were treated with apigenin, esculetin, gomisin N, schisanhenol, schisandrin A, schisandrin B, anwulignan, schisantherin A, schisantherin B, specnuezhenide, schisandrin, luteolin, quinic acid, and curcumenol (40 μM) before being stimulated with APAP. HepaG2 were loaded with MitoSOX red mitochondrial superoxide indicator (Ex/Em: 510/580 nm). After staining and washing, flow cytometry was conducted to test mtROS production. (B) Percentage of ROS-positive cells in HepaG2 cells from samples described in A. (C) The production of mtROS was detected by flow cytometry in HepaG2 cells treated with schisandrin A or schisandrin B (10, 20, and 40 μM). (D,E) Percentage of ROS-positive cells in HepaG2 cells pretreated with schisandrin A (D) or schisandrin B (E) (10, 20, and 40 μM) and then stimulated with APAP, followed by staining with MitoSox. Data are represented as the mean ± SD using biological samples. The significance of the differences was analyzed using unpaired Student’s t-test: *p < 0.05, **p < 0.01, ***p < 0.001 vs. the control, NS, not significant.

