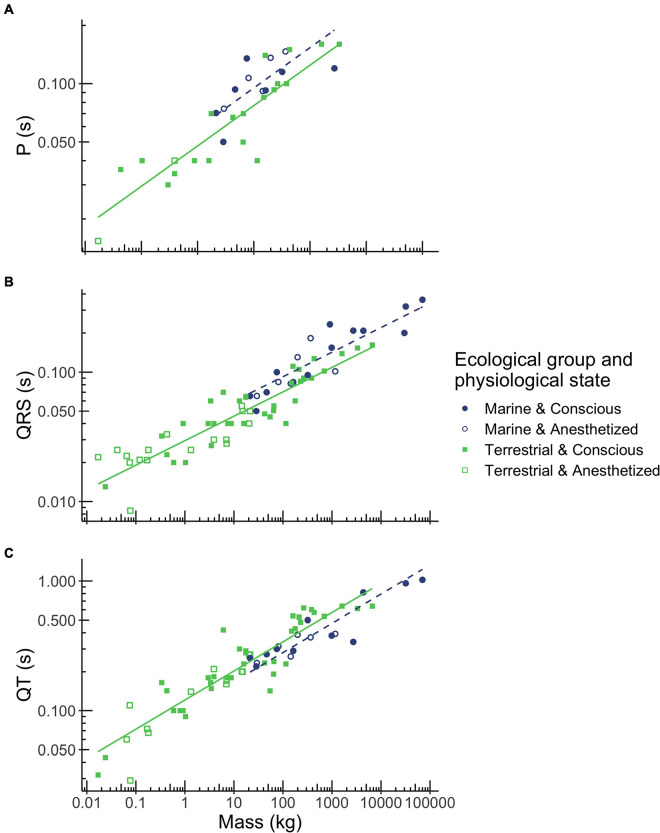
FIGURE 2.
Relationships between body mass, ecological group and P wave duration (A), QRS complex duration (B), and QT interval duration (C) in mammals. Mass was the best predictor for these three ECG parameters. However, durations also depended on ecological group (terrestrial mammals shown in green squares, marine mammals shown in blue circles), but not on physiological state (conscious mammals indicated by closed squares and circles, anesthetized mammals indicated by open squares and circles). Regression equations for each parameter are provided in Table 2.

