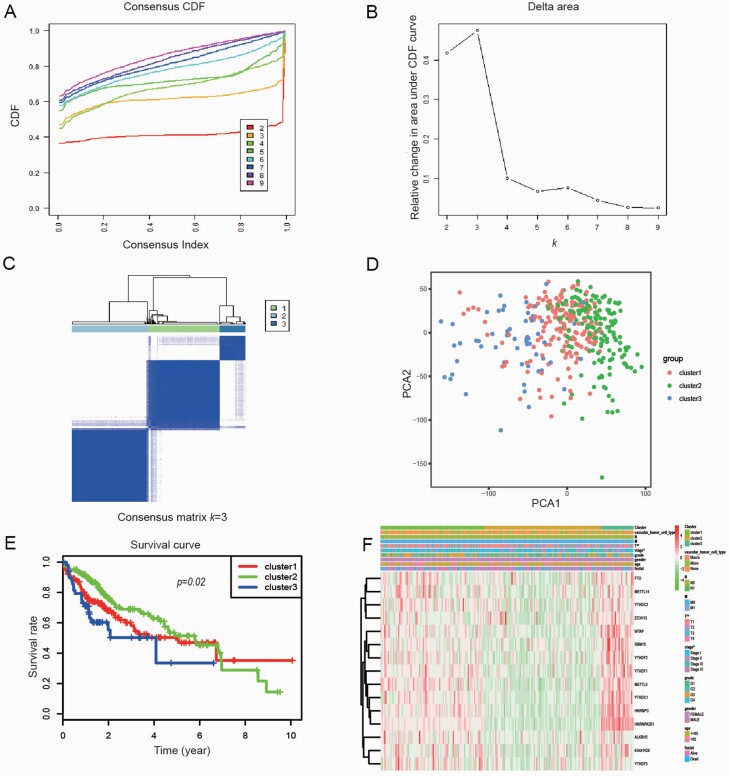
Fig. 4.
Identification of consensus clusters by m6A RNA methylation regulators. (A) Consensus clustering cumulative distribution function (CDF) for k = 2–9; (B) Relative change in area under CDF curve for k = 2–9; (C) Consensus clustering matrix for k = 3; (D) Principal component analysis of the three subgroups; (E) Kaplan–Meier survival plots of the three subgroups; (F) Heatmap and clinicopathologic features of the three clusters defined by the m6A RNA methylation regulators consensus expression (red is upregulated and green is downregulated; *P < 0.05).

