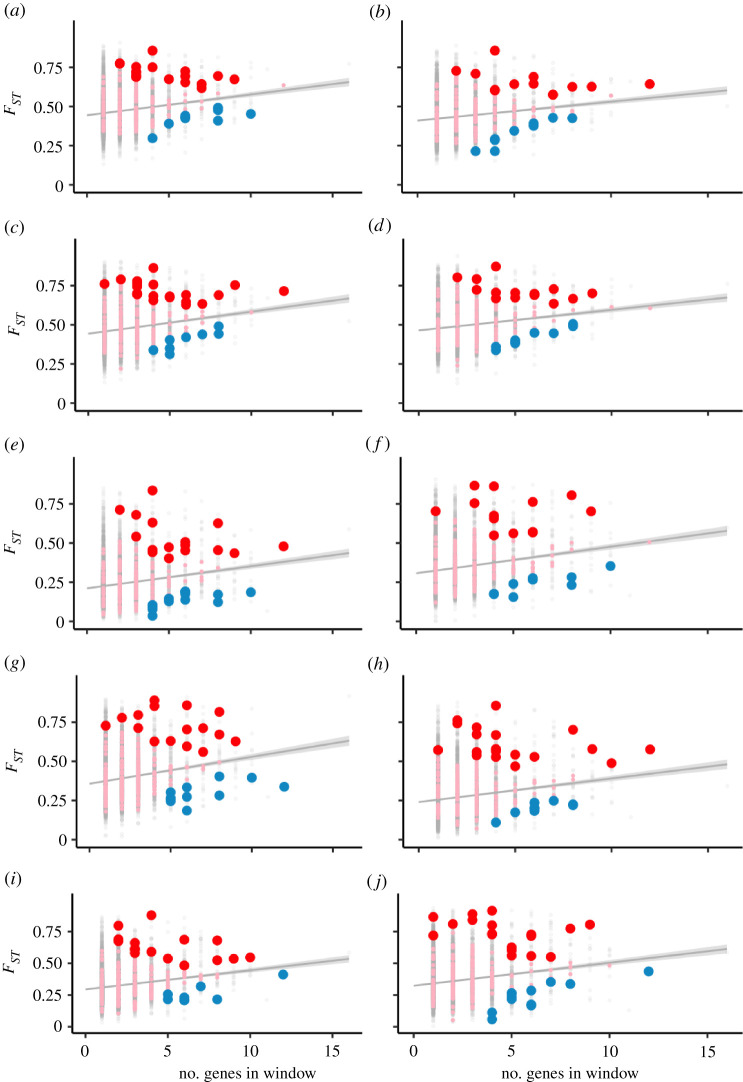
Figure 2.
Ninteract windows have an excess of upper and lower FST outliers after controlling for gene density. Each panel is a pairwise comparison between two of five species: M. nemestrina from Borneo (bor), M. hecki (hec), M. tonkeana (ton), M. maura (mau) and M. nigra (nig) as follows: (a) bor-mau, (b) bor-ton, (c) bor-hec, (d) bor-nig, (e) mau-ton, (f) mau-hec, (g) mau-nig, (h) ton-hec, (i) ton-nig, (j) hec-nig. Genomic windows without and with Ninteract genes are indicated by grey and pink dots, respectively; red and blue dots indicate Ninteract windows that are upper or lower FST outliers, respectively. Because FST was not calculated for some windows owing to genotype quality filtering, the sample size of Ninteract windows (pink, red and blue dots) is 204 and of non-Ninteract windows (grey dots) is 9121. A grey line and grey shading indicate the linear regression and confidence interval for the relationship between FST (y-axis) and the number of genes in each genomic window (x-axis). Acronyms of Ninteract genes in upper FST outliers are provided in the electronic supplementary material, table S3. (Online version in colour.)

