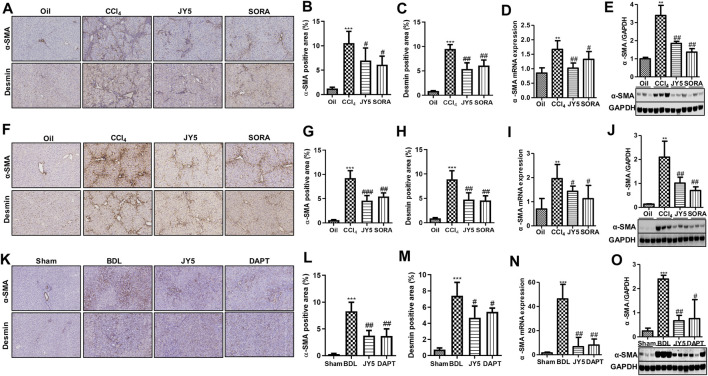
FIGURE 5.
JY5 inhibits the activation of HSCs in vivo. (A) In the CCl4-induced rat liver fibrosis experiment, representative images of IHC (100×) staining for a-SMA and desmin. Quantitative analysis of immunohistochemical staining for a-SMA (B) and desmin. (C) The protein and mRNA levels of a-SMA were, respectively, analyzed by qPCR (D) and Western blotting (E). (F) In the CCl4-induced liver fibrosis mice experiment, representative images of IHC (100×) staining for a-SMA and desmin in liver tissue from mice treated with the various treatments. Quantitative analysis of immunohistochemical staining for a-SMA (G) and desmin. (H) The protein and mRNA levels of a-SMA in mice liver tissue were, respectively, analyzed by qPCR (I) and Western blotting (J). (K) In the BDL-induced rat liver fibrosis experiment, representative images of IHC (100×) staining for a-SMA and desmin in liver tissue. Quantitative analysis of immunohistochemical staining for a-SMA (L)and desmin (M). The protein and mRNA expression of a-SMA was, respectively, analyzed by qPCR (N) and Western blotting (O). **p < 0.01, ***p < 0.001 vs the control group or sham group, # p < 0.05, ## p < 0.01 vs the CCl4 group or BDL group. Oil: control group.

