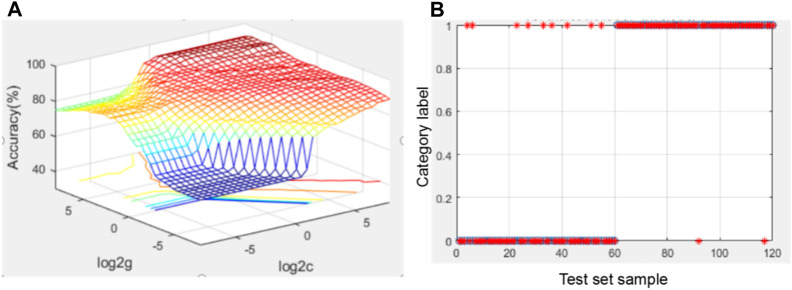
FIGURE 3.
Diagram of optimization results using the grid search method and SVM test results using the four indicators. (A) Optimization result graph of the grid searching method; for the 3D view, the group C and g with the highest accuracy was selected as the optimal C and g; (B) graph of SVM test results under optimal parameters.

