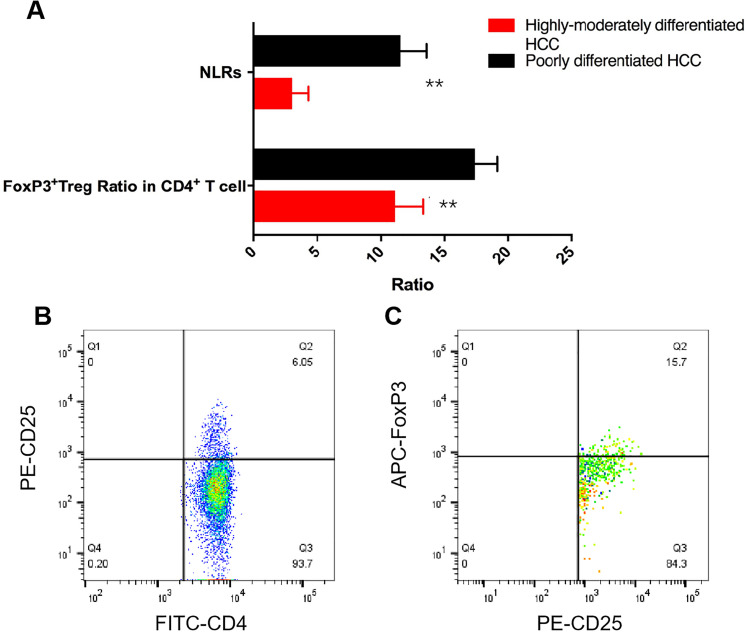
Figure 2.
NLR and Foxp3+Treg expression levels in different HCC group, A, statistical analysis of NLR and Foxp3+Treg in CD4+T cell of different differentiation HCC with t test (n = 136), B, C, were the flow cytometry scatter plot of Foxp3+Treg in different HCC groups.
Abbreviations: NLR, neutrophil–lymphocyte ratio; HCC, hepatocellular carcinoma.

