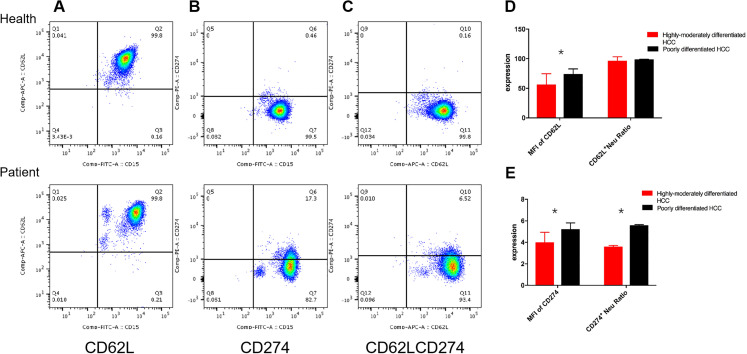
Figure 3.
Expression difference of neutrophils in hepatocellular carcinoma (HCC) patients with different degree of differentiation. A, Flow cytometry scatter plot of CD15+CD62L+NEUT, B, flow cytometry scatter plot of CD15+PDL1+NEUT, C, flow cytometry scatter plot of CD15+CD62L+PDL1+NEUT. D, The MFI of CD62L and CD62L+NEUT in different HCC groups by t test, E, the MFI of PDL1 and PDL1+NEUT in different HCC groups by t test (n = 64).

