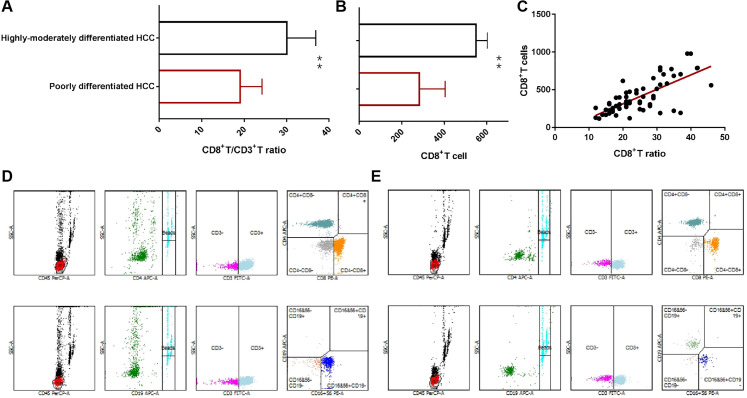
Figure 4.
Expression difference of CD8+T cell in hepatocellular carcinoma (HCC) patients with different degree of differentiation. A, The CD8+T/CD3+T cell ratio in different HCC groups analysis by Chi square test, B, the absolute CD8+T cells in different HCC groups analysis by t test, C, the correlation analysis of CD8+T/CD3+T cell ratio and CD8+T cells (n = 64). D, E, Flow cytometry scatter plot of lymphocyte subsets.

