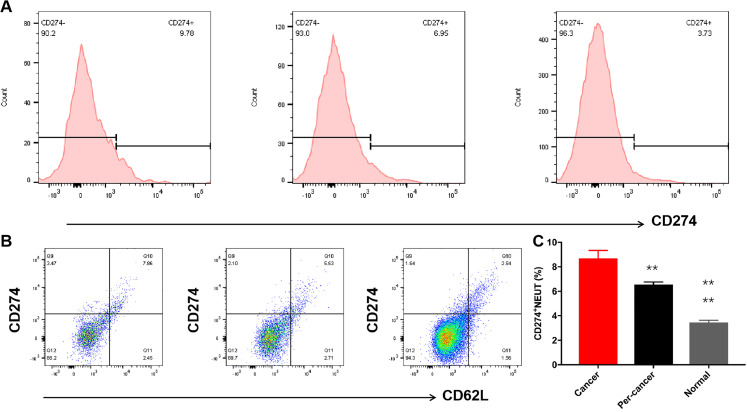
Figure 6.
PDL1+NEUT in different liver cancer tissues. A, The flow cytometry peak value chart of PDL1+NEUT (from left to right is cancer tissue, peritumoral tissue, and normal liver tissue, respectively), B, the flow cytometry scatter plot of PDL1+NEUT (from left to right is cancer tissue, peritumoral tissue, and normal liver tissue, respectively), C, statistical analysis of PDL1+NEUT in different liver tissue by analysis of variance (ANOVA) (n = 64).

