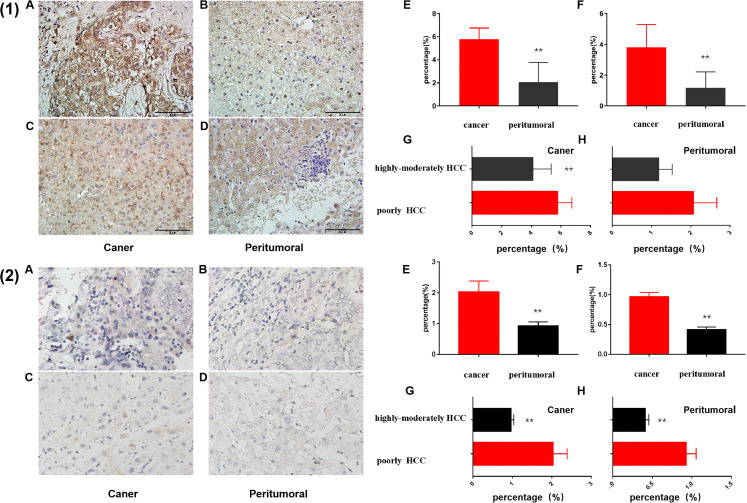
Figure 7.
Foxp3 (1) and PDL-1(2) expression levels of different degrees of differentiation HCC by IHC staining (200 × ). A, B, The staining results of cancer and peritumoral tissue of poorly differentiation HCC, respectively, C, D, staining results of cancer and peritumoral tissue of highly-moderately differentiation HCC, respectively. E, The statistical analysis of expression levels in different tissues of the same differentiation degree HCC by t test. F, In same tumor tissues with different degrees of differentiation by t test (n = 136).
Abbreviations: HCC, hepatocellular carcinoma; IHC, immunohistochemistry.

