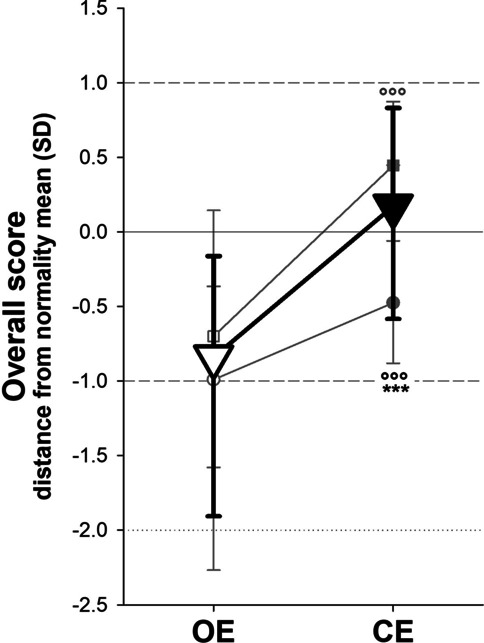
Fig. 2.

Median (symbols) and interquartile range (whiskers) of the overall score compared to normality (zero line) of overall post-COVID syndrome patients (triangles), also splint in hospitalized (circles) and non-hospitalized (squares) patients, with open eyes (OE, open symbols) and closed eyes (CE, close symbols). ***: p < 0.001 hospitalized vs non-hospitalized patients; °°°: p < 0.001 CE vs OE
