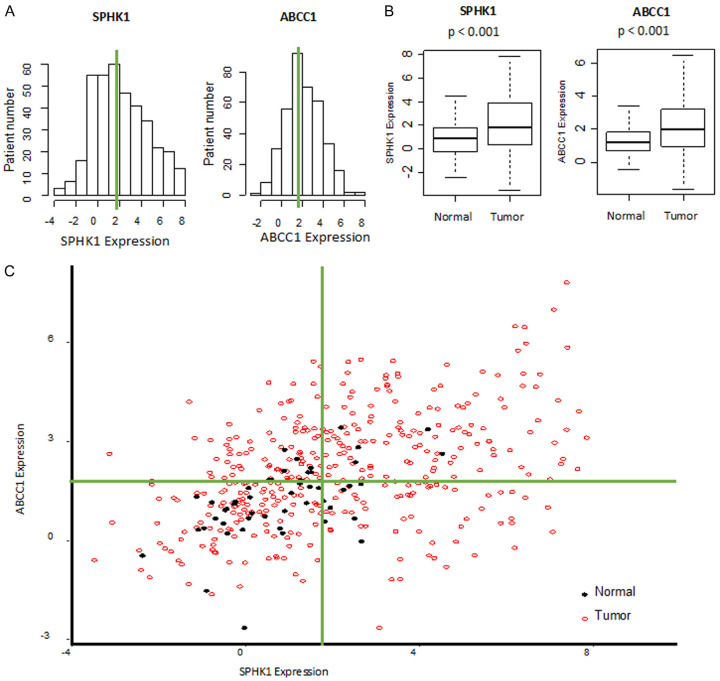
Figure 1.
SphK1 and ABCC1 expressions in the tumor tissue is higher than normal liver in TCGA cohort. A. Histogram of gene expression of SphK1 and ABCC1 in TCGA cohort. B. Gene expressions of SphK1 and ABCC1 in tumor tissue versus normal liver samples. C. Scatter plot showing gene expressions of SphK1 and ABCC1 in tumor tissue (red open circle) and normal liver tissue (closed black circle).

