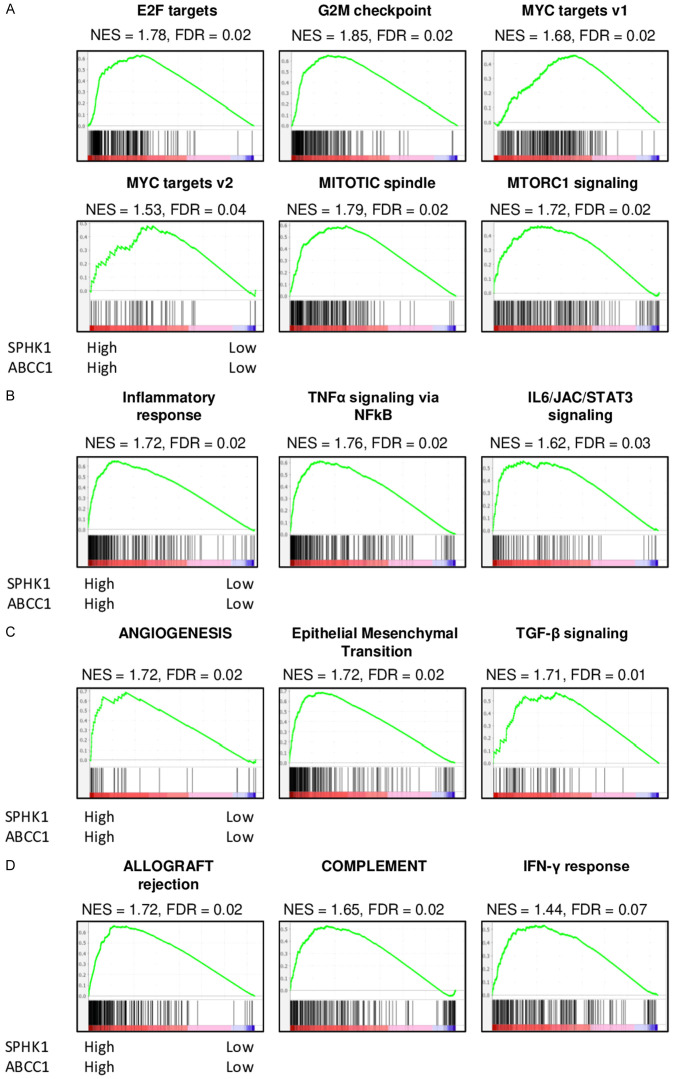
Figure 5.
Comparison of tumors with High expression of both SphK1 and ABCC1 versus Low expression of SphK1 and ABCC1 with Gene Set Enrichment Analysis (A) Cell Proliferation gene sets (B) Inflammation related gene sets (C) metastasis related gene sets (D) Immune response related gene sets. NES: normalized enrichment score; FDR: false discovery rate.

