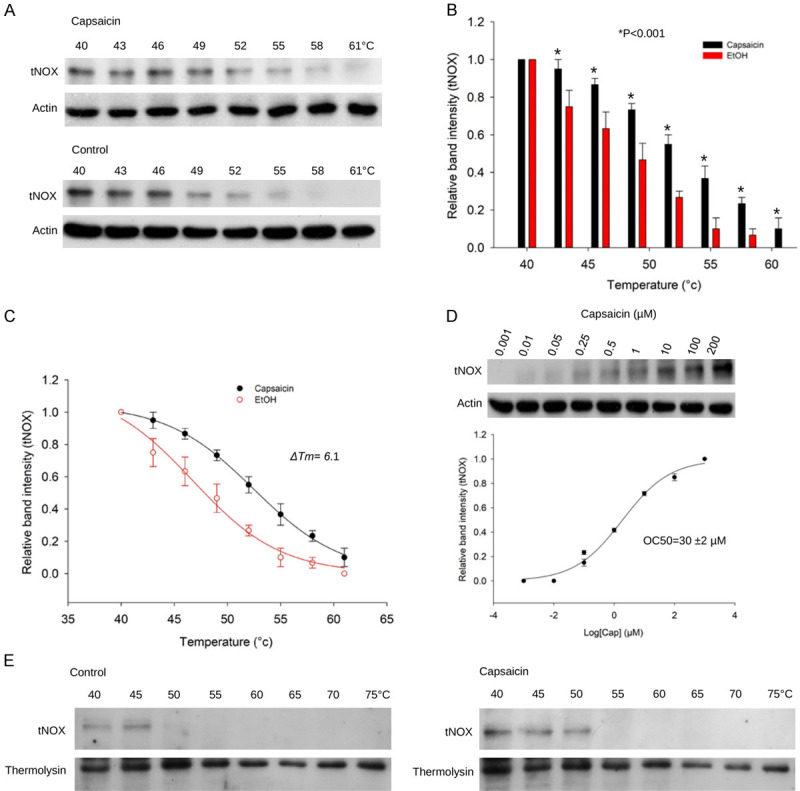
Figure 4.

CETSA-based validation of direct binding between capsaicin and tNOX protein. A. The immunoblot intensity of tNOX in A375 cells in the presence and absence of capsaicin in the CETSA experiments as described in the Material and Methods. Aliquots of cell lysates were resolved by SDS-PAGE and analyzed for protein expression by Western blotting. β-actin was used as an internal loading control to monitor for equal loading. Representative images are shown. B. The quantification of relative intensity of tNOX protein in the presence and absence of capsaicin versus increased temperature from three independent experiments (*P<0.05). C. CETSA-melting curves of tNOX in the presence and absence of capsaicin as described in the Material and Methods in A375 cells. The immunoblot intensity was normalized to the intensity of the 40°C sample. D. A375 cells were incubated with various concentrations of capsaicin at 54°C as described in the Material and Methods. Dose-dependent thermal stability change of tNOX upon capsaicin treatment was evaluated after heating samples at 54°C for 3 min. The band intensities of tNOX were normalized with respect to the intensity of actin. Representative images are shown. E. The immunoblot intensity of tNOX in A375 cells in the presence and absence of capsaicin in the CETSA-pulse proteolysis experiments as described in the Material and Methods. Aliquots of cell lysates were resolved by SDS-PAGE and analyzed for protein expression by Western blotting. Thermolysin was used as a negative control. Representative images are shown.
