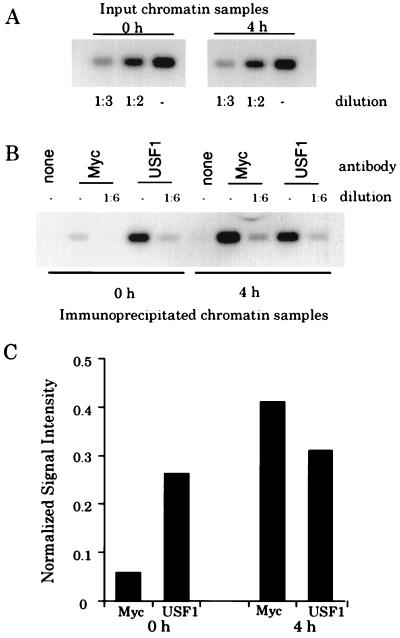
FIG. 1.
Myc does not displace USF from the cad promoter. (A) Fourteen cycles of PCR amplification were performed on chromatin from quiescent cells (0 h) or from cells which had been stimulated with serum for 4 h. Prior to PCR amplification, samples were diluted as indicated. PCR products were electrophoresed on an agarose gel, Southern blotted, hybridized with a radiolabeled cad probe, and analyzed with the phosphorimager with ImageQuant software. (B) PCRs were performed and analyzed as described above for immunoprecipitates from reactions containing no primary antibody (none), c-Myc antibody (Myc), or USF antibody (USF1). (C) Graphical analysis of cad PCR signals from the Southern blot shown in panel B. Normalized signal intensity is the quantitated numerical value of the signals from the diluted (1:6) anti-Myc and -USF1 lanes at 0 and 4 h normalized to the signal intensity of the input chromatin (1:2 diluted) for the 0- and 4-h samples, respectively. The signal intensity of the input chromatin (1:2 diluted) was arbitrarily set to a value of 1, and the normalized signals are presented as a fraction of this value.

