
Figure 1. Trends in Cardiovascular Risk Factors in US Adults.
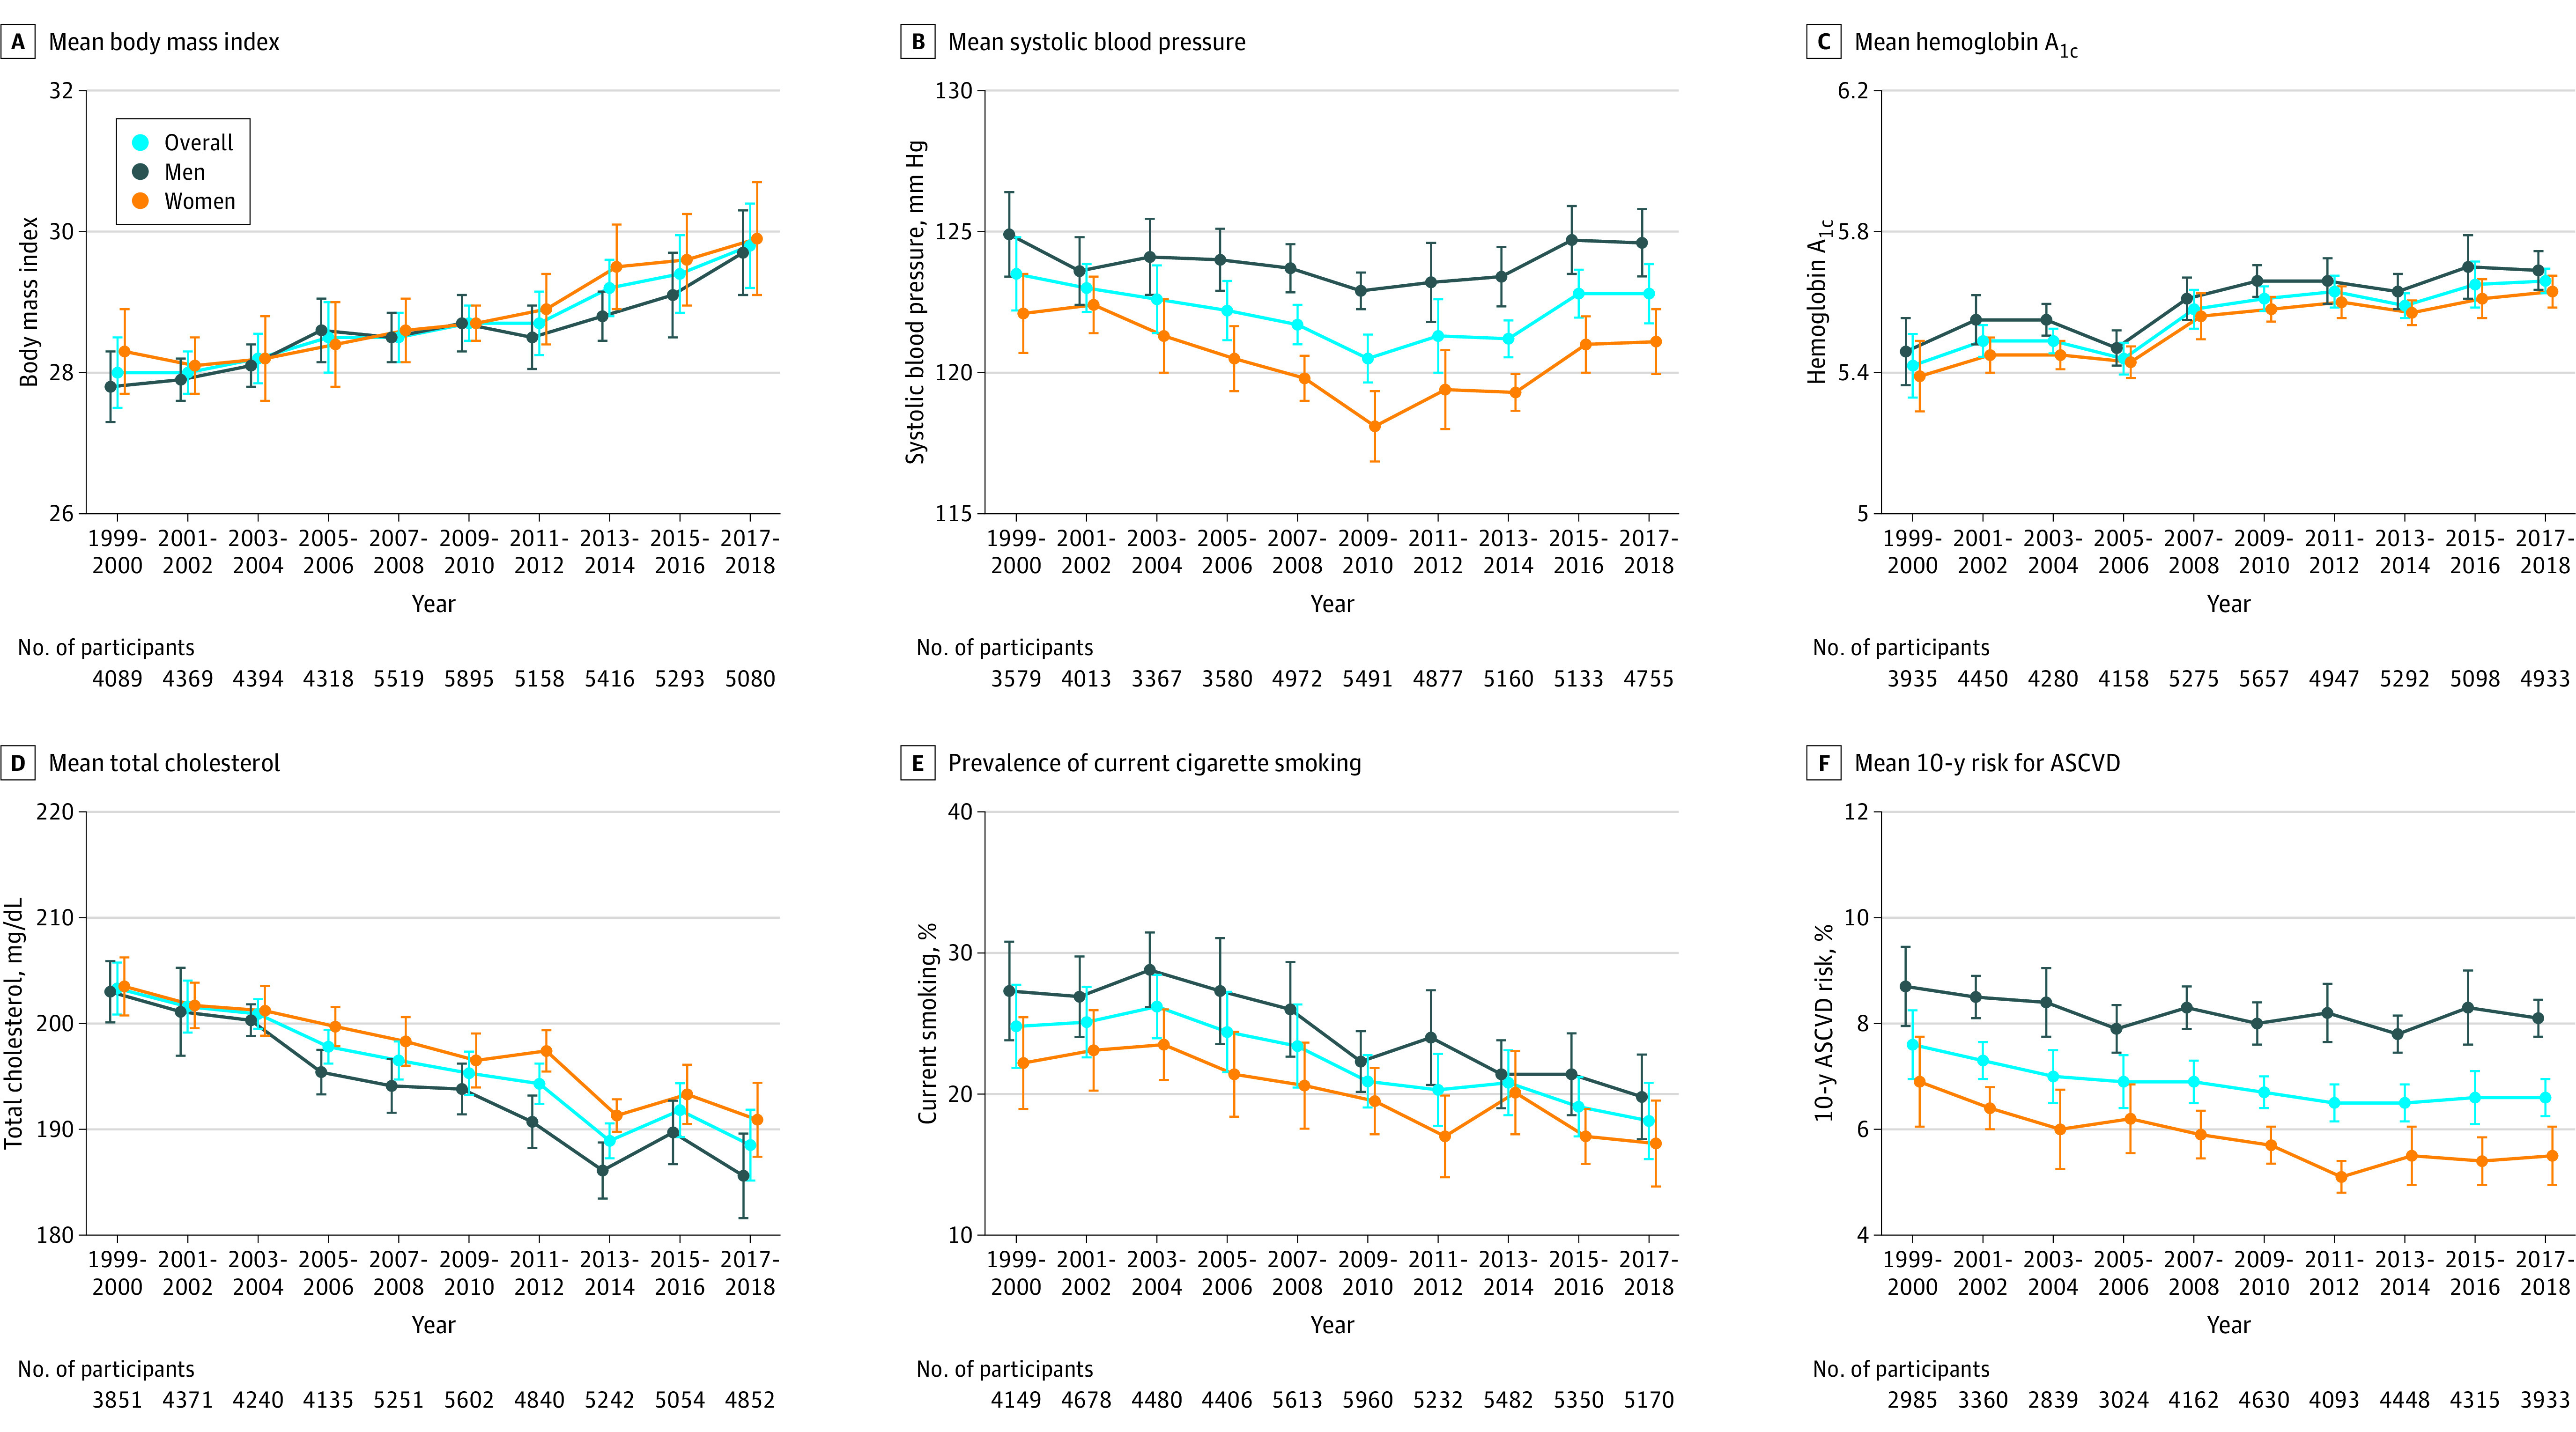
Trends in (A) mean body mass index (calculated as weight in kilograms divided by height in meters squared) (all P < .001 for linear trend); (B) mean systolic blood pressure (P < .001 overall, P = .01 for men, and P < .001 women for nonlinear trend); (C) mean hemoglobin A1c (all P < .001 for linear trend); (D) mean serum total cholesterol (to convert to millimoles per liter, multiply by 0.0259) (all P < .001 for linear trend); (E) prevalence of current cigarette smoking (all P < .001 for linear trend); and (F) mean estimated 10-year risk of atherosclerotic cardiovascular disease (ASCVD) (P < .001 overall, P = .10 for men, and P < .001 for women for linear trend). The 10-year risk of ASCVD was calculated using the Pooled Cohort Equations among individuals without a self-reported history of cardiovascular disease. The probability of developing ASCVD over 10 years ranged from 0% to 100%. All estimates were standardized to the 2000 US Census population using 6 age and sex categories: men aged 20-39, 40-59, and ≥60 years and women aged 20-39, 40-59, and ≥60 years. Linear and polynomial models were used to test linear and nonlinear trends. Error bars indicate 95% CIs.