
Figure 4. Trends in Cardiovascular Risk Factors by Family Income-to-Poverty Ratio in US Adults.
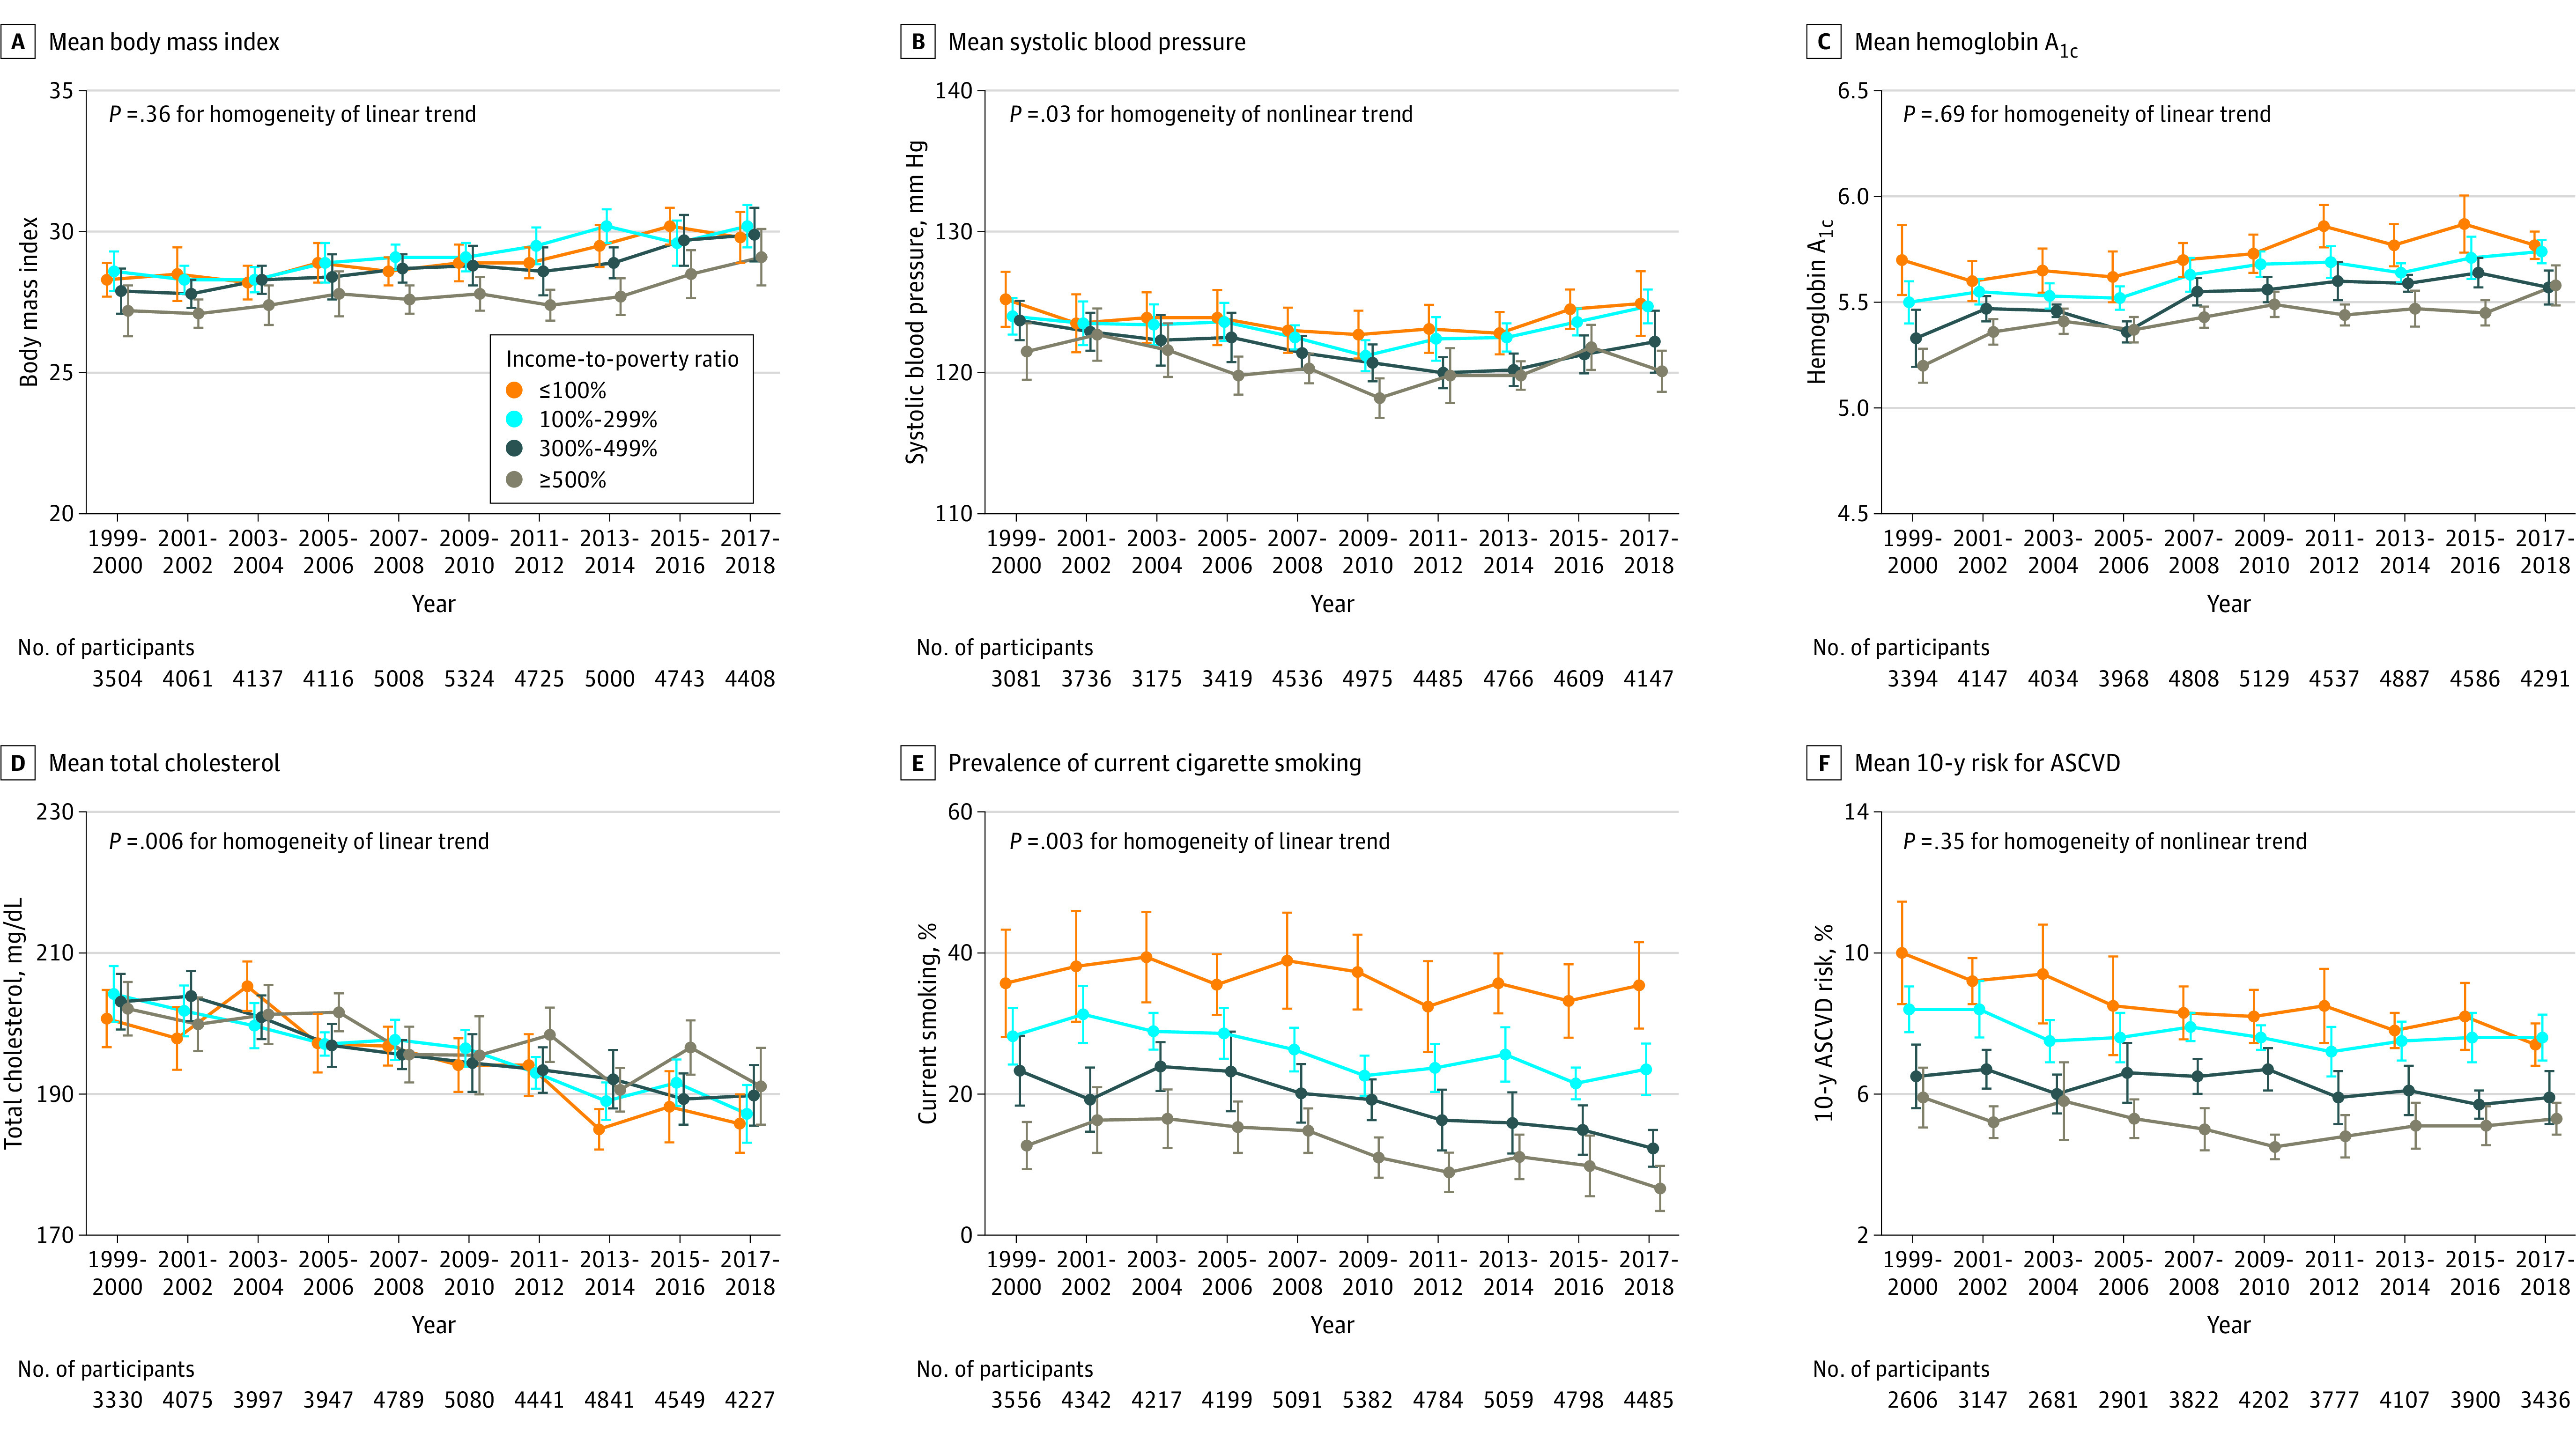
Trends in (A) mean body mass index (calculated as weight in kilograms divided by height in meters squared) (all P < .001 for linear trend); (B) mean systolic blood pressure (all P ≤ .03 for nonlinear trend); (C) mean hemoglobin A1c (all P < .001 for linear trend); (D) mean serum total cholesterol (to convert to millimoles per liter, multiply by 0.0259) (all P < .001 for linear trend); (E) prevalence of current cigarette smoking (P = .15 for linear trend in individuals with an income-to-poverty ratio ≤100%; P < .001 for linear trend for all others); and (F) mean estimated 10-year risk of atherosclerotic cardiovascular disease (ASCVD) (P < .001, P = .02, and P = .06 for linear trend in individuals with income-to-poverty ratios ≤100%, >100-299%, and 300-499%, respectively; P = .009 for nonlinear trend in individuals with an income-to-poverty ratio ≥500%). The 10-year risk of ASCVD was calculated using the Pooled Cohort Equations among individuals without a self-reported history of cardiovascular disease. The probability of developing ASCVD over 10 years ranged from 0% to 100%. All estimates were standardized to the 2000 US Census population using 6 age and sex categories: men aged 20-39, 40-59, and ≥60 years and women aged 20-39, 40-59, and ≥60 years. The poverty threshold for a 4-person family was $17 029 in 1999 ($25 743 in 2018 dollar value) and $25 701 in 2018. Linear and polynomial models were used to test linear and nonlinear trends. The homogeneity of trends among family income subgroups was tested using an interaction term of time × family income subgroup in the regression models. Error bars indicate 95% CIs.