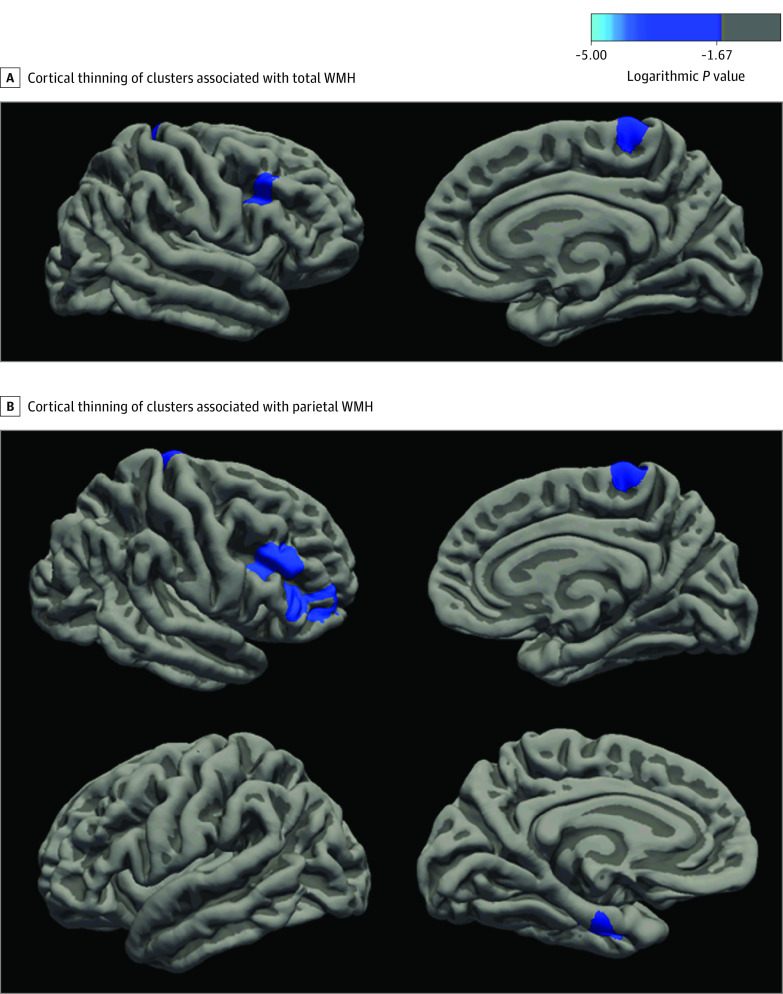
Figure 2. Lateral and Medial Views of the Right Hemisphere, With Cortical Thinning of Clusters Associated With White Matter Hyperintensities (WMH).
A, Lateral (top left) and medial (top right) view of the right hemisphere, showing areas of cortical thinning associated with total WMH, including the caudal middle frontal and paracentral cortex. B, Lateral (top left) and medial (top right) view of the right hemisphere, showing areas of cortical thinning associated with parietal WMH, including the rostral middle frontal, pars triangularis, and paracentral cortices. Lateral (bottom left) and medial (bottom right) view of the left hemisphere, showing areas of cortical thinning associated with parietal WMH, including the entorhinal cortex. Clusters that survive a multiple comparison correction at a significance threshold of P < .01 are shown. The color scale indicates cluster-level logarithmic P values; a negative value in this legend indicates a negative correlation, whereas a positive value would indicate a positive correlation.

