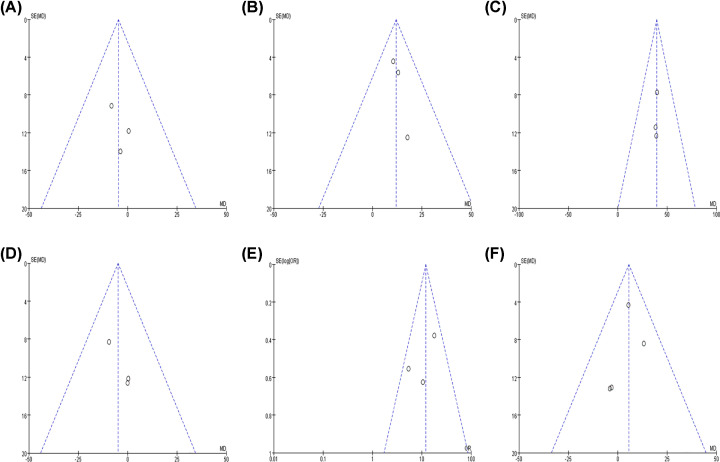
Figure 9. Funnel plots for detection of publication bias.
The pseudo 95% confidence interval (CI) is computed as part of the analysis that produces the funnel plot and corresponding to the expected 95% CI for a given standard error (SE). (A) CD68+ TAM number and differentiation; (B) CD68+ TAM number and lymph node metastasis; (C) CD163+ TAM number and lymph node metastasis; (D) CD163+ TAM number and differentiation; (E) CD68+ TAM high expression; (F) CD163+ TAM number and age of patients.

