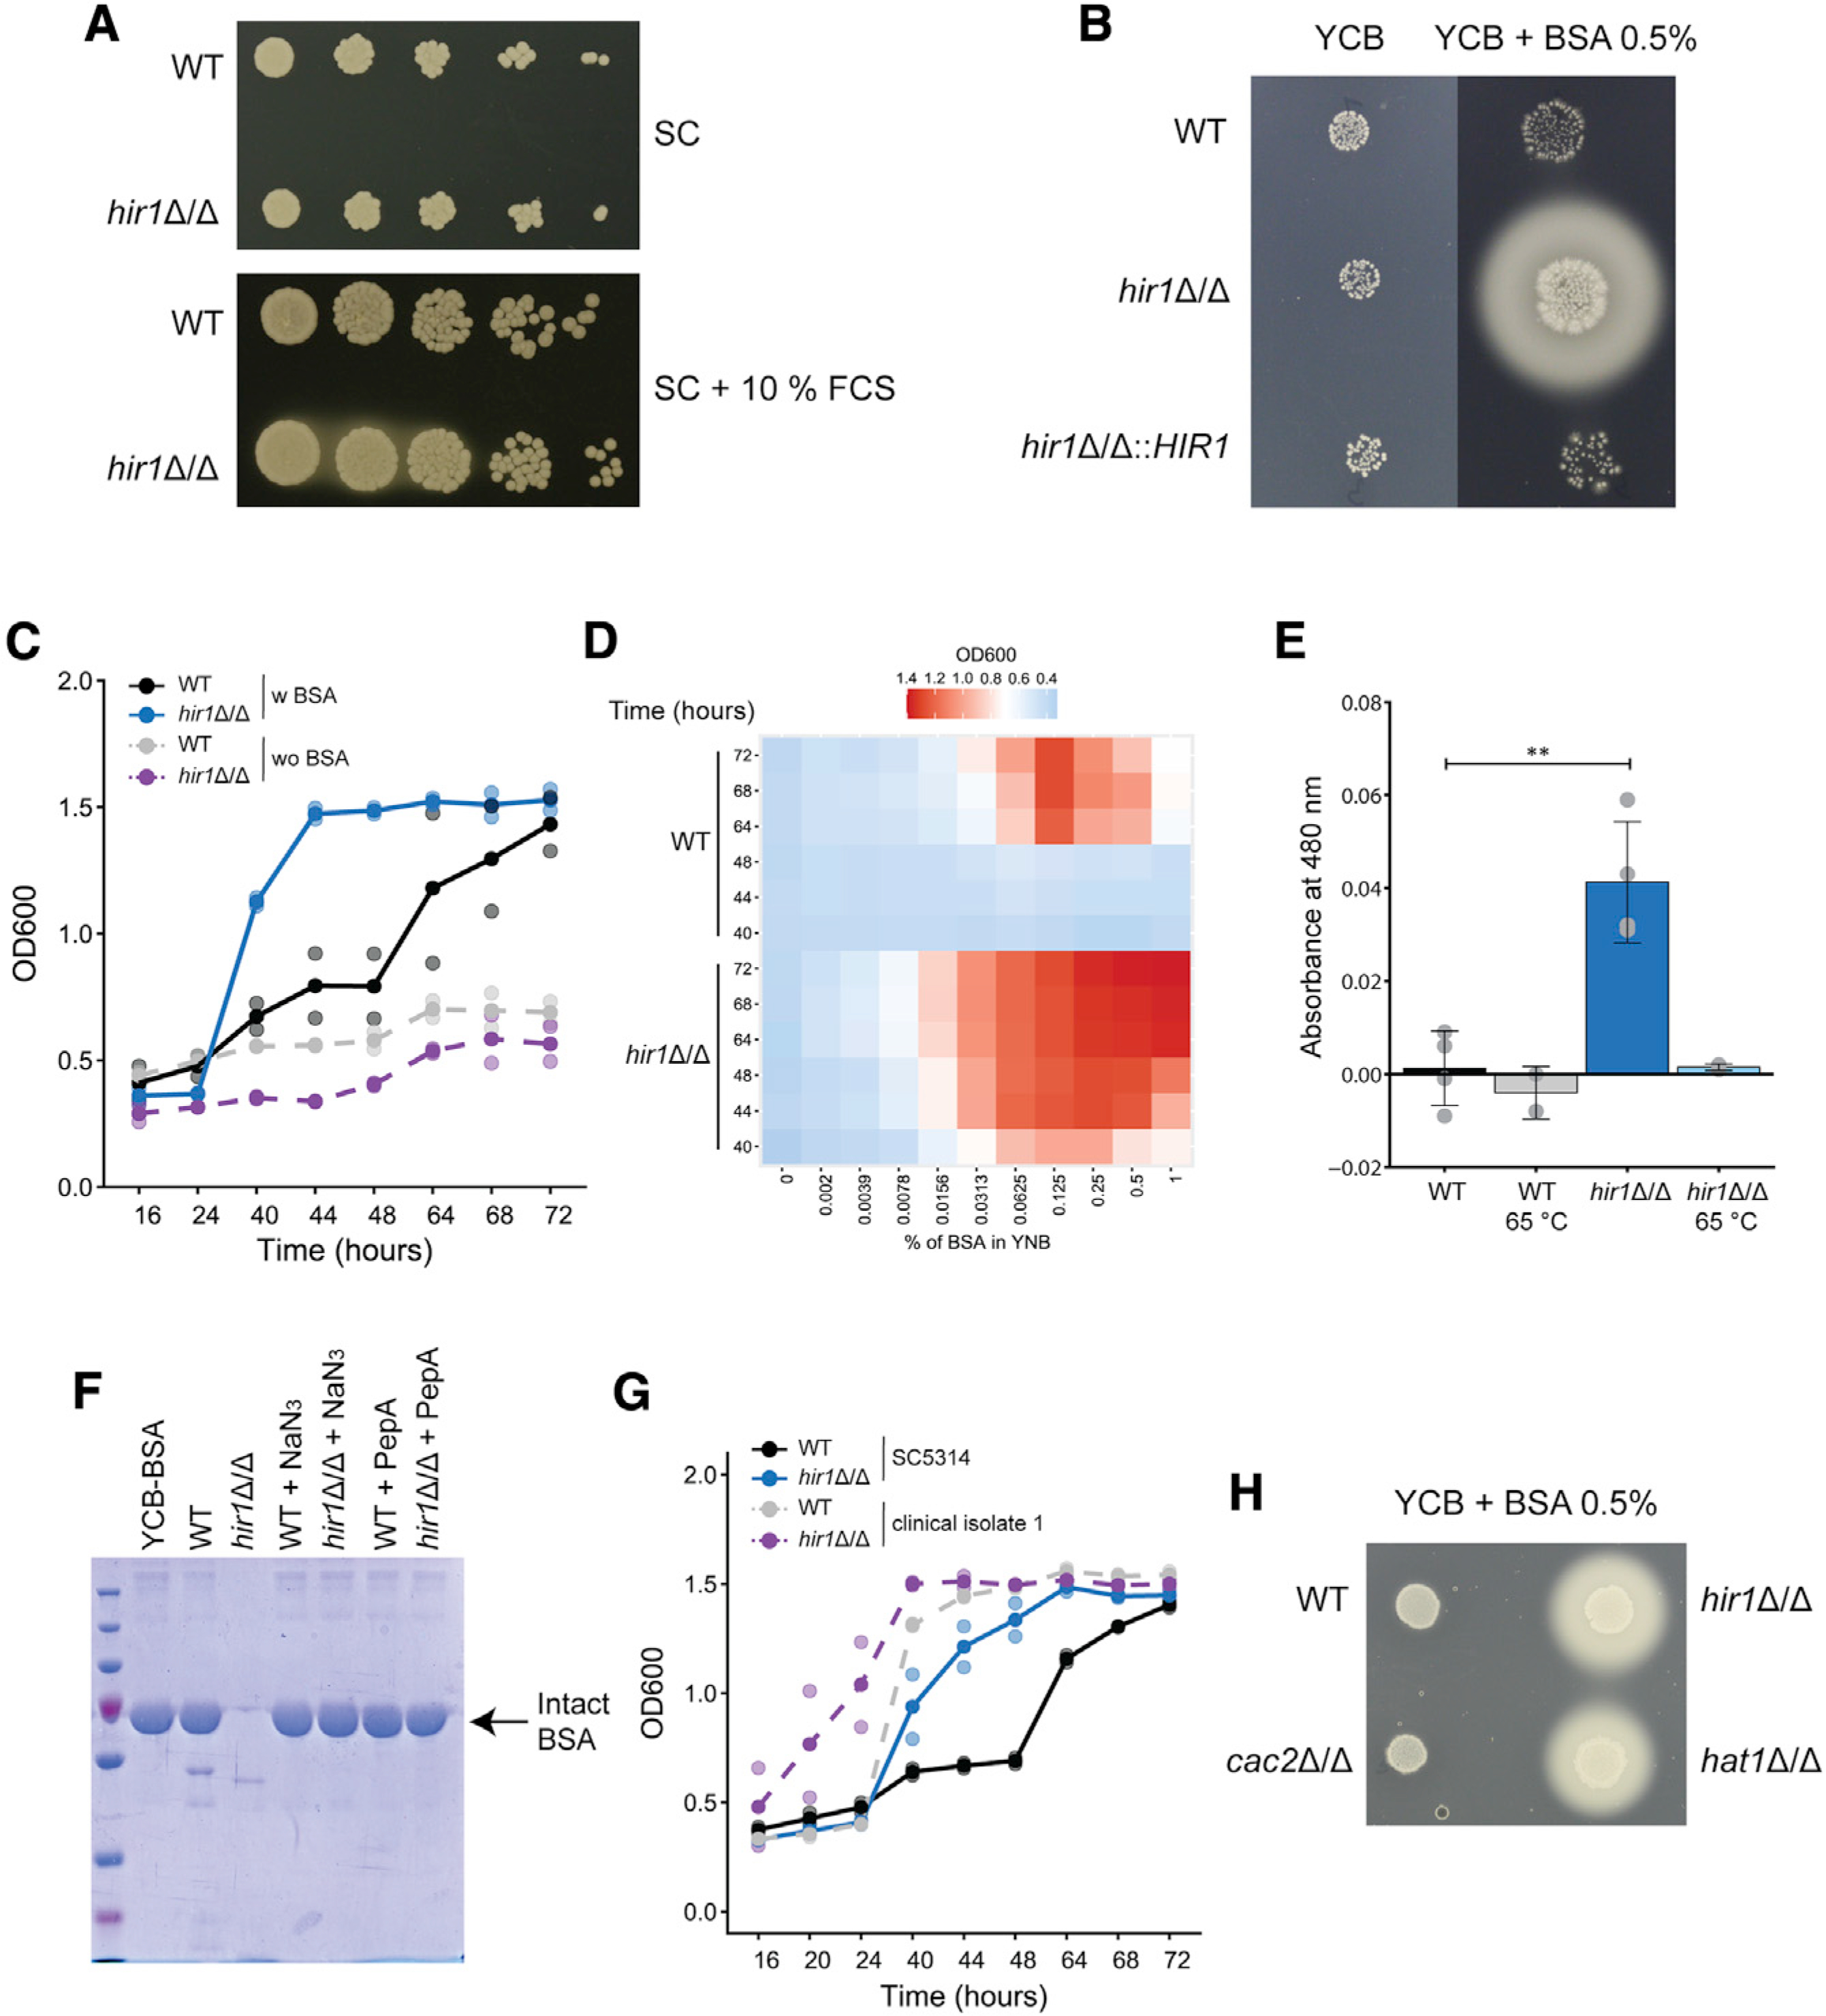
Figure 1. Deletion of HIR1 drives proteolytic activities.

(A) Spot dilution assay on SC agar medium ±10% FCS. Images were taken after 1 day at 30°C and are representative of 3 biological replicates. Brightness (−50) and contrast (+20) were adjusted.
(B) Images of colony spots after 3 days at 30°C and are representative of 3 biological replicates.
(C) Growth of the indicated C. albicans strains in liquid YCB-BSA at 30°C. See also Figure S1E. Graphs show the mean (solid dots) and single measurements (opaque dots) from 2 biological replicates.
(D) Growth of C. albicans in YNB supplemented with the indicated percentage of BSA at 30°C. Colors of the heatmap indicate mean OD600 values from 3–4 biological replicates.
(E) Azocasein assay with YCB-BSA 24 h culture supernatants heat-treated (65°C, 10 min) or not treated prior the assay. Graphs show the mean ± SD from 2–4 biological replicates. ***p < 0.001 with Student’s t test after equal variance testing (F test).
(F) Coomassie staining of supernatants from 16 h YCB-BSA cultures, non-treated or treated with 0.01% sodium azide (NaN3) or 1 μM PepstatinA (PepA). The arrow indicates full-length BSA. The gel image is representative of 2 biological replicates.
(G) Growth of the indicated C. albicans strains and clinical isolates in liquid YCB-BSA at 30°C. See also Figure S1F. Graphs show the mean (solid dots) and single measurement values (opaque dots) from 2 biological replicates.
(H) Images of colony spots as in (B) after 4 days at 30°C, which are representative of 2 biological replicates.
w, with; wo, without. See also Figure S1.
