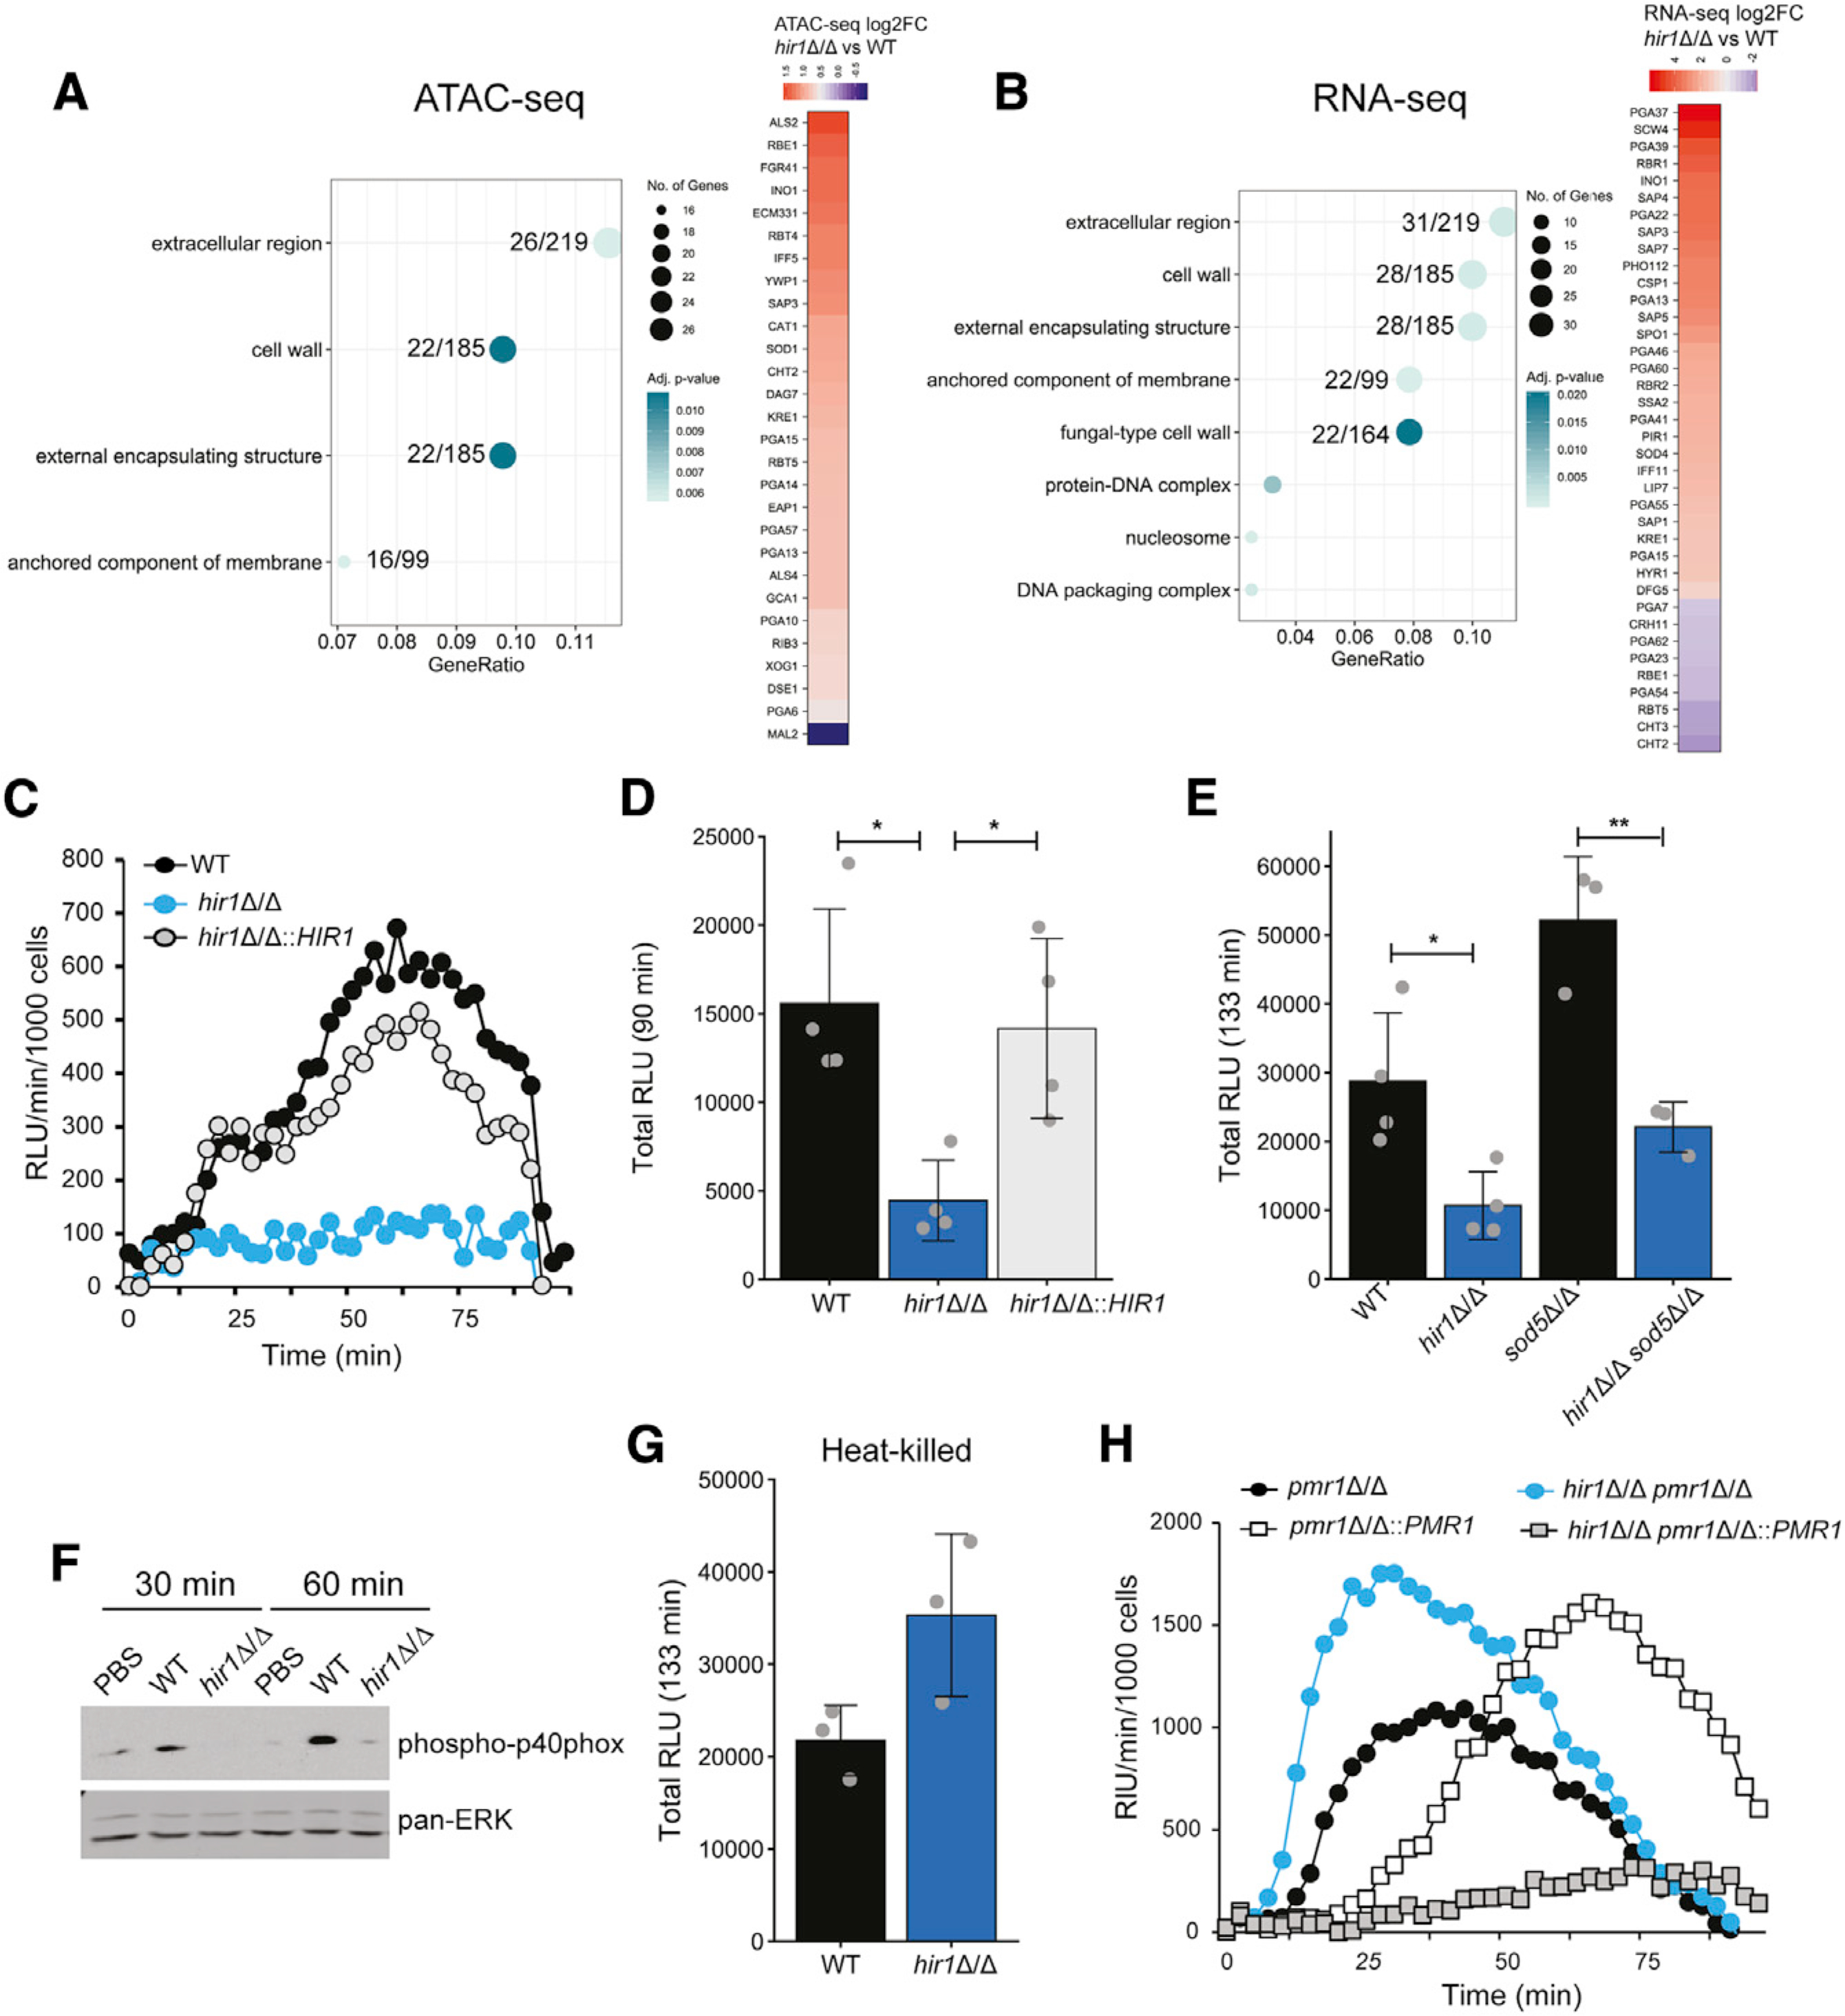
Figure 5. Hir1 affects fungal recognition by macrophages in vitro.

(A and B) GO enrichment analysis of ATAC-seq peaks (A) and RNA-seq signals (B) differentially regulated (FDR <0.05) in hir1Δ/Δ cells during growth in YPD. The GeneRatio denotes the number of genes enriched in the depicted GO term relative to the total number of input genes. The number of genes from the input dataset relative to the total number of genes associated with the plotted GO category is depicted.
(C–E) ROS assay of BMDMs challenged with the indicated strains, depicted as RLU per minute per 1,000 BMDMs over time (C) or as the total RLU after the indicated time (D and E). Graphs show the mean ± SD from 3–4 biological replicates. *p < 0.05, **p < 0.01 with one-way ANOVA followed by Tukey’s multiple comparison test after testing for equal variances (Bartlett’s test) for (D) and with Student’s t test after testing for equal variances (F-test) in (E).
(F) Immunoblot analysis of phosphorylated p40phox in BMDMs challenged with the indicated fungal strains or PBS. Blot is representative of 3 biological replicates.
(G) ROS assay of BMDMs infected with heat-killed C. albicans. Graphs show the mean ± SD from 3 biological replicates.
(H) ROS assay of BMDMs challenged with different fungal genotypes presented as RLU per minute per 1,000 BMDMs over time. Results are representative of 3 biological replicates.
FDR, false discovery rate; BMDMs, bone-marrow-derived macrophages; RLU, relative luciferase units. See also Figure S5.
