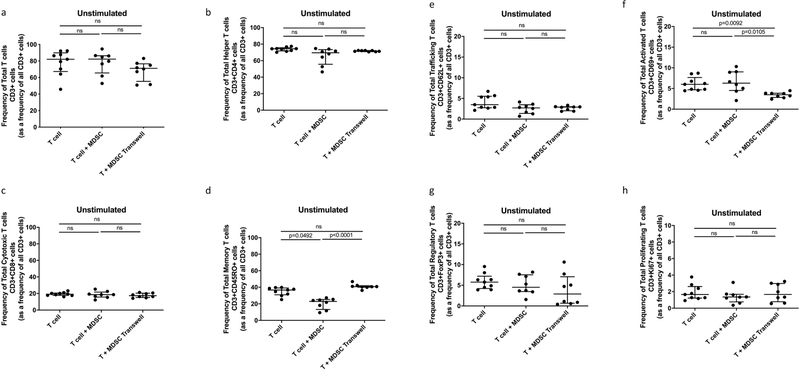
Fig. 2.
Effect of MDSC on Unstimulated Total T cell and T cell subset responses. Frequency of Total T cells (CD3+) and T cell subsets from in vitro T cell co-culture as well as trans-well co-culture of allogeneic T cells (CD3+ cells) isolated from PBMC of a Quantiferon positive individual (9 replicates), and MDSC (HLA-CD33+ cells) isolated from PBMC of individuals with active TB disease (n = 9). Plots show QFT+ individual T cell replicates. Panels a-g show T cell frequency of various subsets and panel h shows cell proliferation as measure of T cell response. Kruskal-Wallis test with Dunns post-hoc test. Median with interquartile range indicated on plots. P < 0.05 was considered significant.

