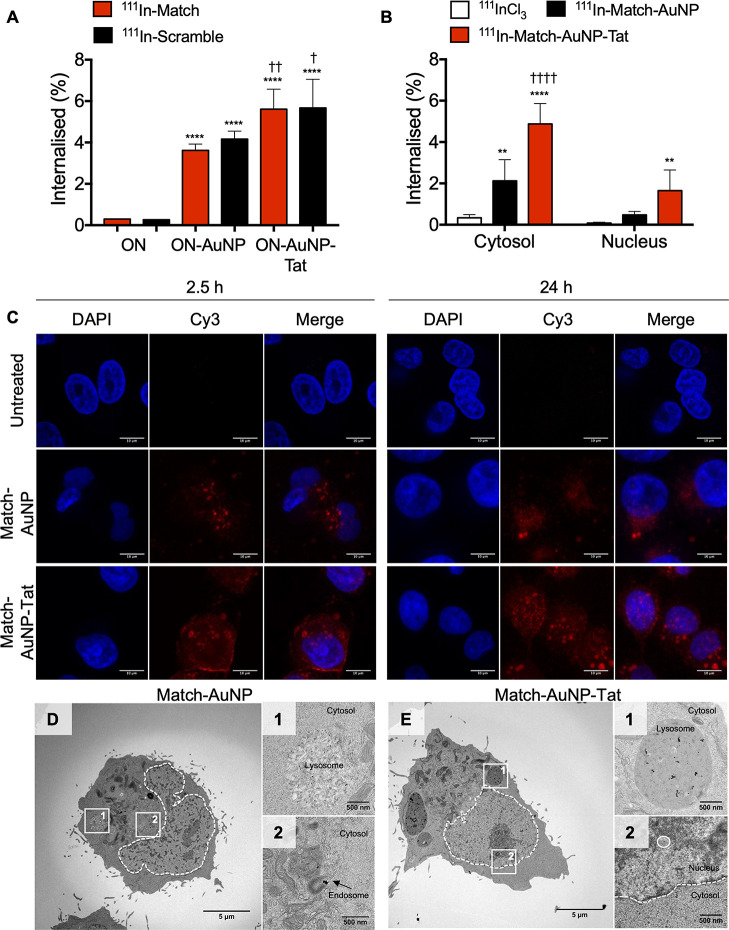
Figure 2.
Subcellular distribution of hTR-targeting AuNPs. (A) Internalization of ON–AuNP and ON–AuNP–Tat. * = significant difference compared to free oligonucleotides (ON); † = significant difference compared to ON–AuNP (one-way ANOVA, multiple comparison, each performed in three independent experiments). (B) Intracellular distribution (fractionation assays) of AuNPs, 111In–Match–AuNP, and 111In–Match–AuNP–Tat. * = significant difference compared to 111InCl3; † = significant difference compared to 111In–Match–AuNP. * or †, p < 0.05; ** or ††, p < 0.01: *** or †††, p < 0.001; **** or ††††, p < 0.0001. Two-way ANOVA, multiple comparison, n = 3 replicates, four independent experiments. (C) Subcellular distribution of AuNP constructs in MDA-MB-435 cells after incubation for 2.5 or 24 h. The cells were incubated with medium only, Cy3–Match–AuNP (500 nM), or Cy3–Match–AuNP–Tat (500 nM). Images were acquired using a 63×/1.4 objective lens with an additional 4× digital zoom. Nuclei were stained with DAPI. The scale bar is 10 μm. (D) Whole-cell TEM image of Match–AuNP-treated cells. (D-1) Lysosome-like vesicle with Match–AuNP. (D-2) Endosomal vesicles with Match–AuNP. (E) Whole-cell image of Match–AuNP–Tat-treated cells. (E-1) Large lysosomal vesicle with Match–AuNP–Tat. (E-2) Nucleus with Match–AuNP–Tat.

