Figure 2.

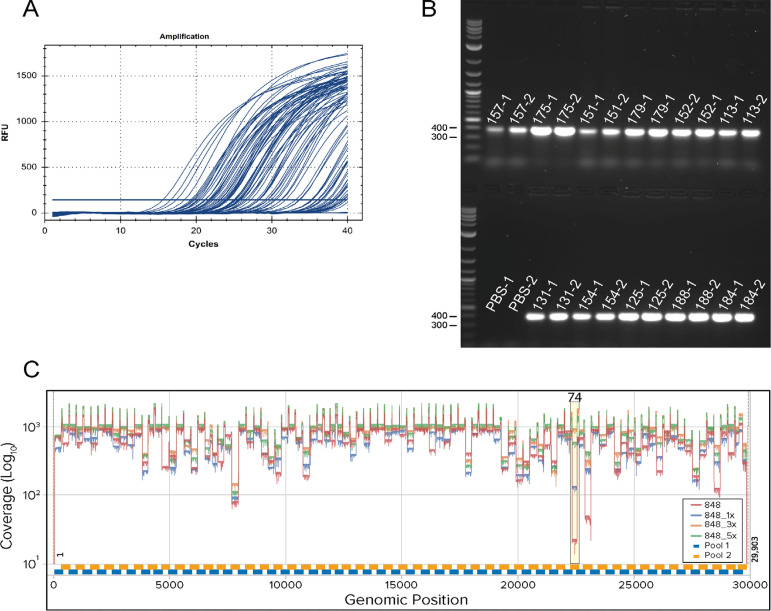
Representative qPCR and ARTIC PCR and genome sequencing coverage.A. Amplification curves from SARS-CoV-2 qPCR assay and IDT 2019-nCoV CDC approved N2 primers and probes. Baseline adjustment was manually set to 200. B. Representative agarose gel electrophoresis of ~400 bp PCR products amplified using ARTIC nCoV V3 Primers (IDT). Reaction pool 1 (labels with suffixes -1) and pool 2 (labels with suffixes -2) were run side by side with 5 μl of sample on the gel. PBS (no template) extraction controls for pool 1 and 2 show no contamination. C. Coverage plot with amplicon 74 dropout using ARTIC V3 Primers (bottom panel). The plot shows no spike-in (red), 1× (15 nM) (blue), 3× (45 nM) (orange) and 5x (75 nM) (green) of 74_Right and 74_Left for sample 848 (Ct = 20.68) with coverage for amplicon 74 of 18×, 126×, 929× and 541×, respectively. Experiments were conducted at the same time using identical reagents and protocols. Amplicon 74 region is highlighted in yellow.
