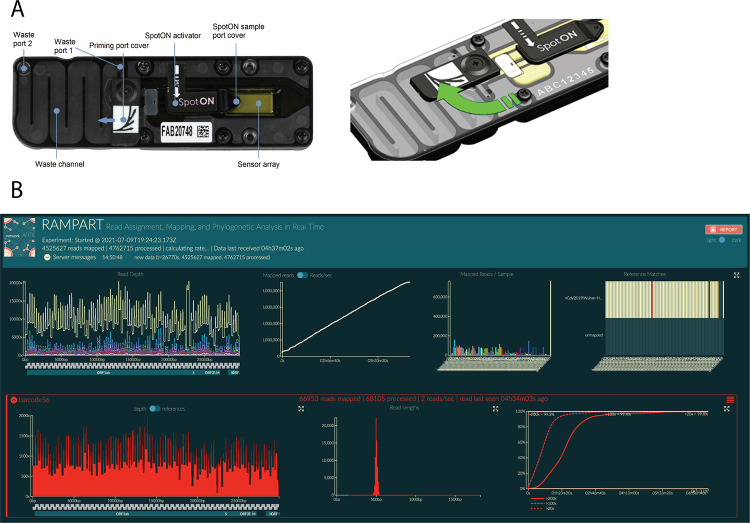
Figure 3.

Loading and running the MinION for SARS-CoV-2 genome sequencing.A. Image of the R9.4.1 Flow Cell displaying the different components of the device (left panel). An illustration demonstrating the priming port opening to primer port cover turning clockwise to expose the opening of the priming port (right panel). B. Example of RAMPART display. Top from left to right: (1) Top left shows coverage across the genomes for all samples. (2) Number of mapped reads through time. (3) Number of reads mapped for each barcode sample. (4) Heatmap showing reads mapped to nCoV2019| Wuhan-Hu-1 (accession MN908947). Bottom from left to right: (5) The coverage across the genome for an individual sample. (6) Read length distribution for an individual barcoded sample showing the expected peak of ~400 bp. (7) Percent > 20×, > 100×, and > 200× as a function of time.
