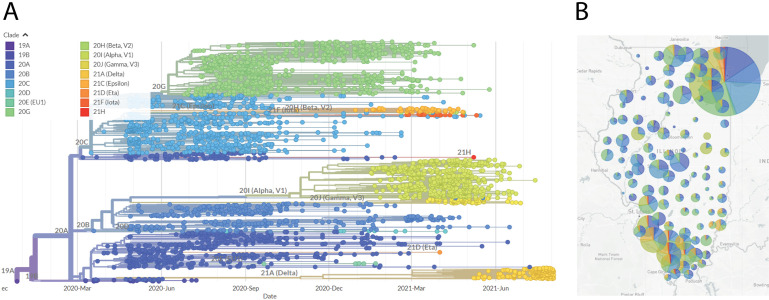
Figure 4.

Nextstrain phylogenetic visualization and map view of SARS-CoV-2 genome sequences.A. Phylogenetic tree generated by the Nextstrain pipeline. Sequences are derived from samples taken in Illinois, from April 2020 through August 2021, and sequenced by our laboratory. Clade colors are indicated. B. Map of Illinois showing sample locations, by county. The size of the circle indicates the relative number of sequences derived from that county. The pie chart indicates the proportional distribution of Nextstrain clades at that location. Clade designation colors correlate with those designated in panel (A).
