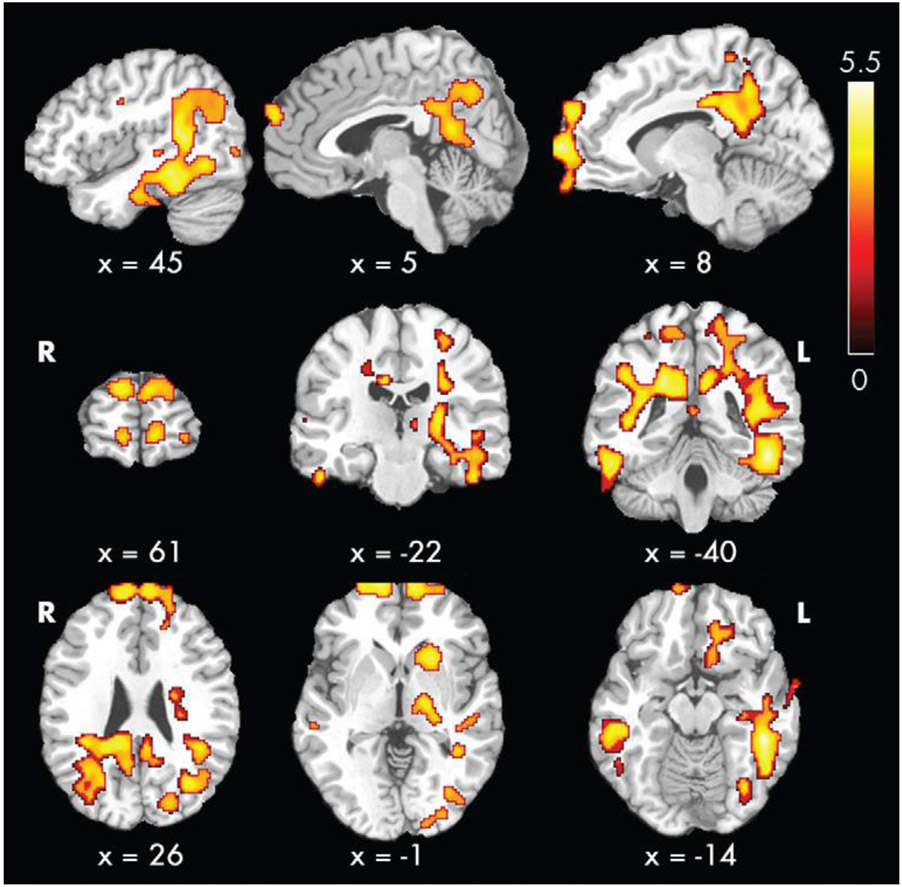
Figure 1 -.
From Liu 2018 [38], reprinted with permission: demonstration of voxel-wise group comparison of cerebral blood flow after removal of effects of hematocrit level, age, and sex. Contrast shown here demonstrates the regions where those with CKD have greater cerebral blood flow than controls. Of note, there were no regions in this analysis where controls had greater regions than those with CKD. Color bar indicates t scores. x, y, z = coordinates in Montreal Neurological Institute (MNI) space.

