Figure 3.
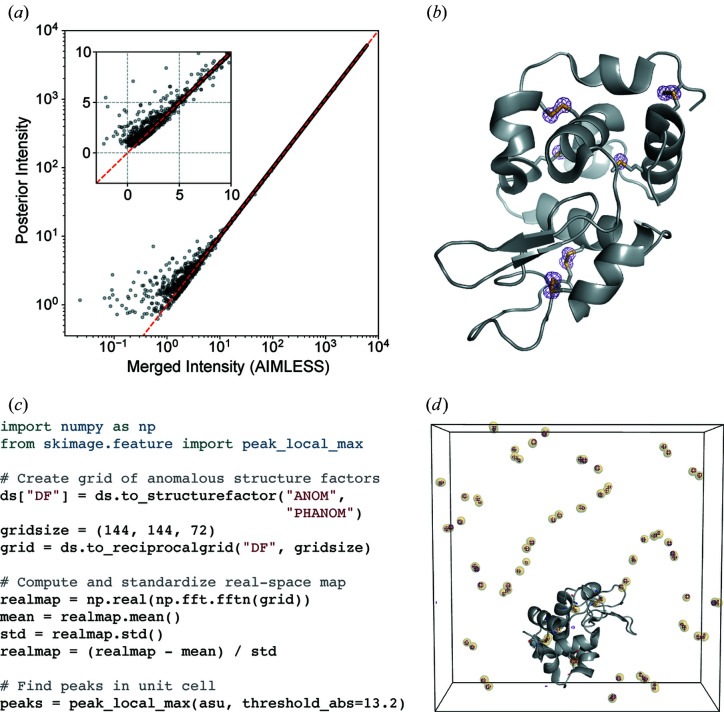
Analysis of anomalous differences from a sulfur SAD experiment. (a) Application of the French–Wilson algorithm to merged intensities. Large intensities are relatively unchanged, while small and negative intensities are corrected to be strictly positive. The red dashed line shows y = x and the inset highlights the small and negative merged intensities. (b) An anomalous difference map using difference structure factor amplitudes derived from the room-temperature sulfur SAD data set and phases from the refined model (PDB 7l84). The map is contoured at 5σ. (c) Example code for identifying anomalous scattering sites in an anomalous difference map. (d) The unit cell containing sulfur sites identified using the code snippet (yellow spheres), overlaid with the anomalous difference map (purple mesh, contoured at 10σ). The protein molecule from one asymmetric unit of PDB 7l84 is shown in gray. The images in (b) and (d) were rendered using PyMOL (Schrödinger, 2020 ▸).

