Figure 4.
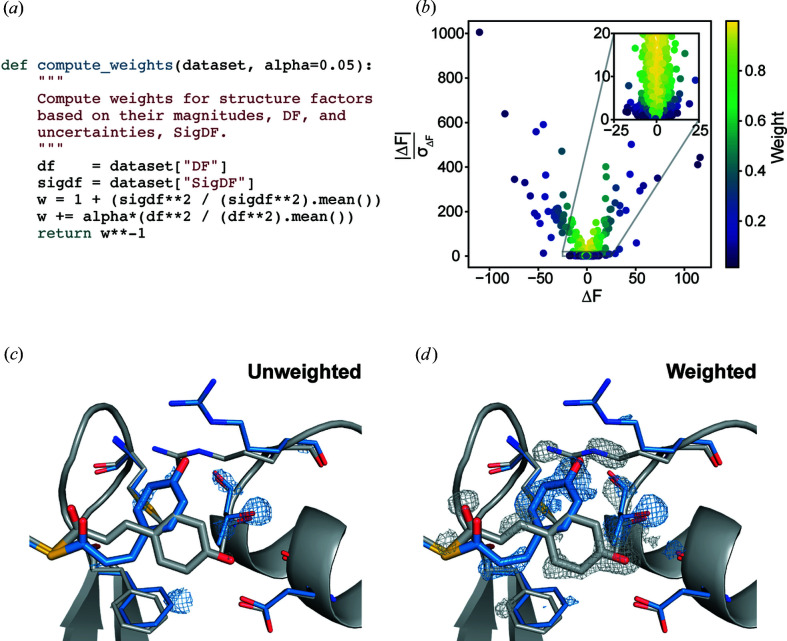
Weighting a time-resolved difference map. (a) The Python function for applying weights to arrays of difference structure factor amplitudes and uncertainties. (b) A scatter plot showing the weights assigned to each observed difference structure factor amplitude with α = 0.05. (c) An unweighted |F on| − |F off| difference map in the vicinity of the PYP chromophore. (d) A weighted |F on| − |F off| difference map with α = 0.05. The trans (ground state) PYP structure (gray) is taken from PDB entry 2phy and the cis (excited, pB state) PYP structure (blue) is taken from PDB entry 3ume (Tripathi et al., 2012 ▸). The difference maps are contoured at ±3σ and were carved within 1.2 Å of the displayed residues. These figures were rendered using PyMOL (Schrödinger, 2020 ▸).

