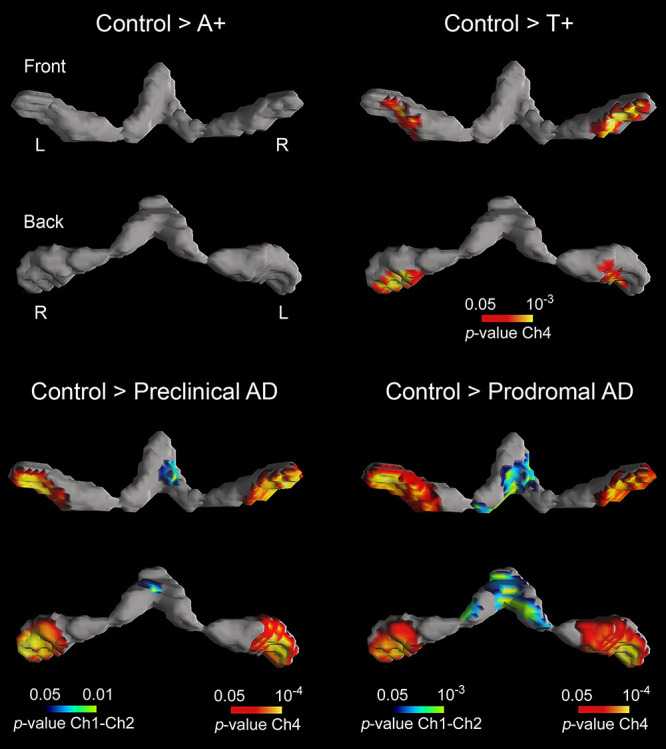
Figure 1 .

Group differences in GM volume of BF cholinergic compartments. Results were corrected for multiple comparisons (FWE, P < 0.05). L, left; R, right. Note that AD pathology, as revealed by abnormal CSF levels of Aβ1–42 and p-tau, determines the extent of BF atrophy.
