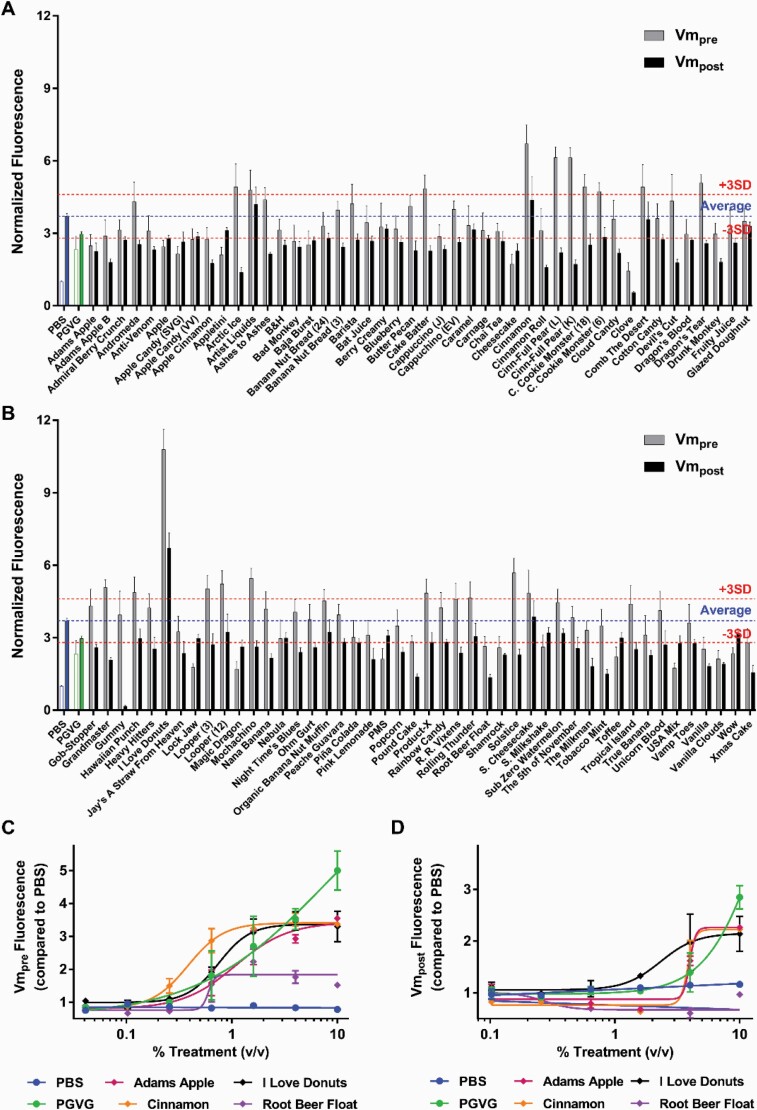
Figure 4.
E-liquids effect on Vm. (A–B) Primary screen of 92 e-liquids (1% vol/vol). Values normalized to Vm-pre PBS response. Blue dotted lined represents average PBS Vm-post. PG/VG is shown in green. Red dotted lines show average Vm-post response ± 3 SD. N = 8. (C) Vm-pre dose–response curves for PBS (●), PG/VG (●), and representative e-liquids. (D) Vm-post dose–response curves for PBS (●), PG/VG (●), and the same representative e-liquids. N = 4 per group.

