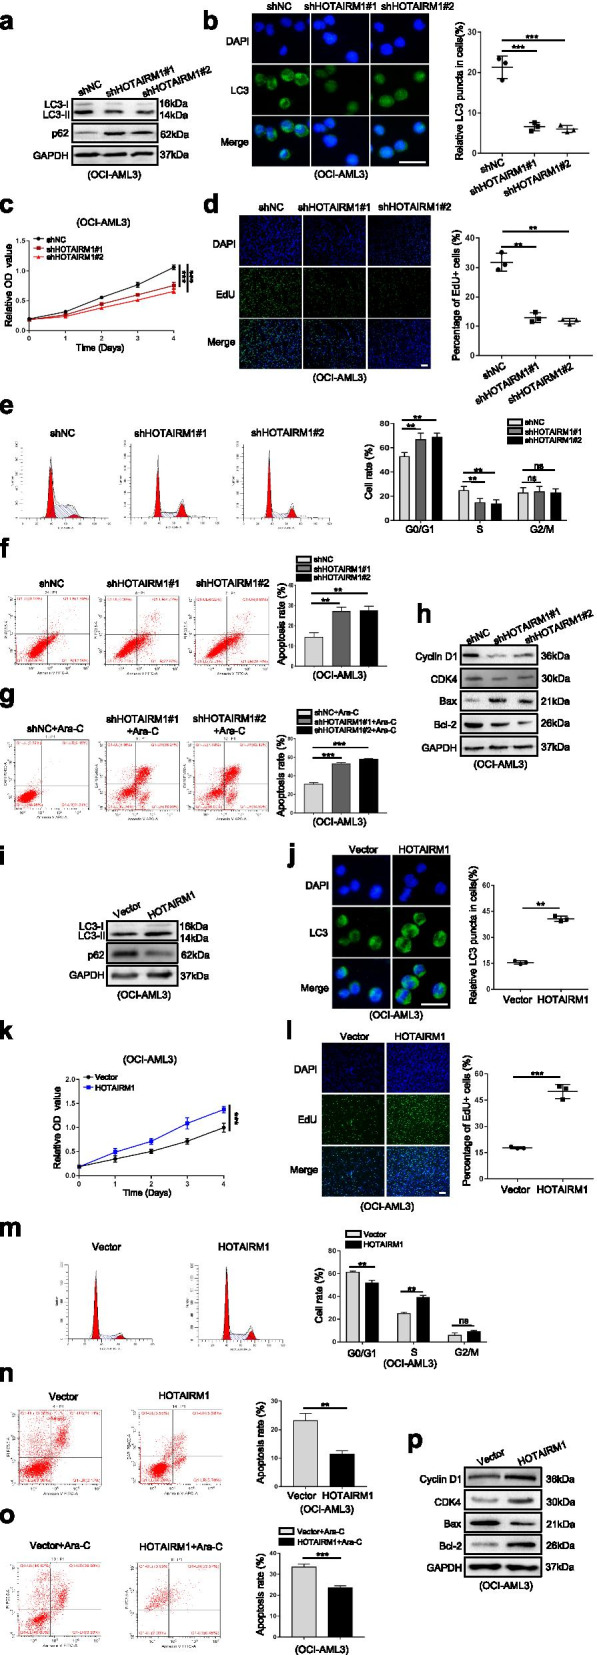
Fig. 3.

HOTAIRM1 promotes leukemia cell autophagy and proliferation. a, i Western blot analysis of LC3-II and p62 levels in OCI-AML3 cells after transfection of shHOTAIRM1 (a) and HOTAIRM1 expression vector (i). b, j Representative microscopy images of LC3 puncta in HOTAIRM1-silenced OCI-AML3 (b) and HOTAIRM1-enforced OCI-AML3 (j). The bar graphs showed the quantification of the fluorescent puncta data. Scale bar: 25 μm. c, k Evaluation of cell viability in OCI-AML3 cells transfected with shHOTAIRM1 (c) or HOTAIRM1 plasmid (k) for indicated by CCK-8 assays. d, l Evaluation of cell proliferation in HOTAIRM1-silenced (d) and HOTAIRM1-enforced OCI-AML3 cells (l) for indicated by EdU assays. The bar graphs showed the percentage of EdU positive cells. Scale bar: 100 μm. e, m Flow cytometry was performed to assess cell cycle of HOTAIRM1-silenced (e) and HOTAIRM1-enforced OCI-AML3 cells (m). The bar graph shows the percentages of G0/G1-, S-, and G2/M-phase cells. f, n Flow cytometry was used to detect the apoptosis of HOTAIRM1-silenced (f) and HOTAIRM1- overexpressing OCI-AML3 cells (n). LL, dead cells; UL, viable cells; LR, early apoptotic cells; UR, late apoptotic cells. g, o Flow cytometry analysis was performed to analyze apoptosis of OCI-AML3 cells after transfection with shHOTAIRM1 (g) or HOTAIRM1 plasmid (o), followed by treatment with 10 μM Ara-C for 48 h. h, p The protein levels of Cyclin D1, CDK4, Bax and Bcl-2 in HOTAIRM1-silenced (h) and HOTAIRM1-enforced OCI-AML3 cells (p). The data are presented as the mean ± SD of three independent experiments. **P < 0.01, ***P < 0.001. n.s. indicates no significant difference
