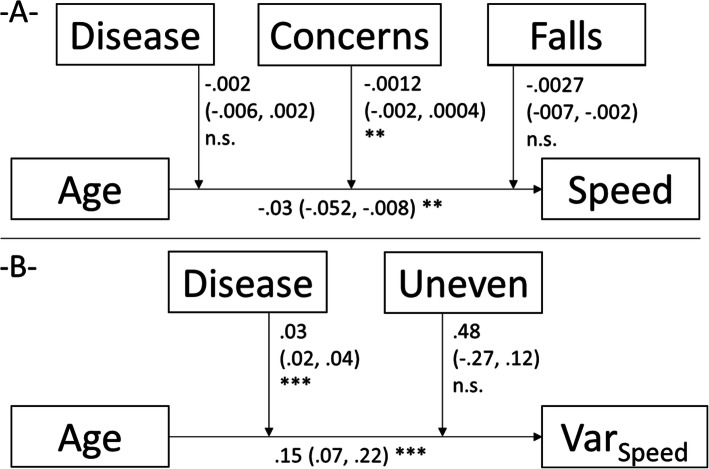
Fig. 2.
Results of the linear mixed moderation analyses for the dependent variables Gait speed (speed) (-A-) and gait speed variability (Varspeed) (-B-). In each part, the model with the best fit is displayed (without the excluded variables). Each time, the estimates of how strong the independent variable predicts the dependent variable and of how strong the moderators impacts on this association, are displayed. The estimates (95% confidence intervals), and significance levels are displayed. *, p < .05; **, p < .01; ***, p < .001; Disease, history of a potentially fall affecting disease; falls, history of fall(s) in the past 6 months; Concerns, concerns of falling estimated by the FES-I-7 items; Uneven, concerns of falls during walking on uneven surfaces

