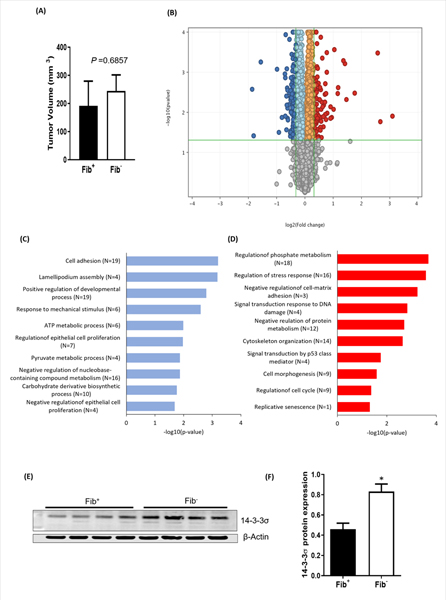
Figure 3. Fibrinogen promotes tumor growth by altering expression of key genes involved in cell cycle regulation and metabolism.
(A) MC38 cells were injected into the dorsal subcutis of Fib+ and Fib− mice and harvested 14 days after inoculation for RNAseq analyses. Note that at this early time point there were no fibrinogen-dependent differences in tumor size. (B) Volcano plot illustrating differentially expressed genes. Red dots are genes upregulated in tumors from Fib− mice relative to Fib+, and green dots are downregulated genes compared to Fib+. 14-3-3σ is one of the most significantly upregulated genes in Fib− tumors. Also shown are gene ontology (GO) analyses of biological functions for genes downregulated (C) and upregulated (D) in Fib− tumors relative to Fib+ tumors. Western blot (E) and relative densitometry (F) confirming increased expression of 14-3-3σ in Fib− tumors relative to Fib. Error bars represent SEMs (*p < 0.05, Mann Whitney U test).

