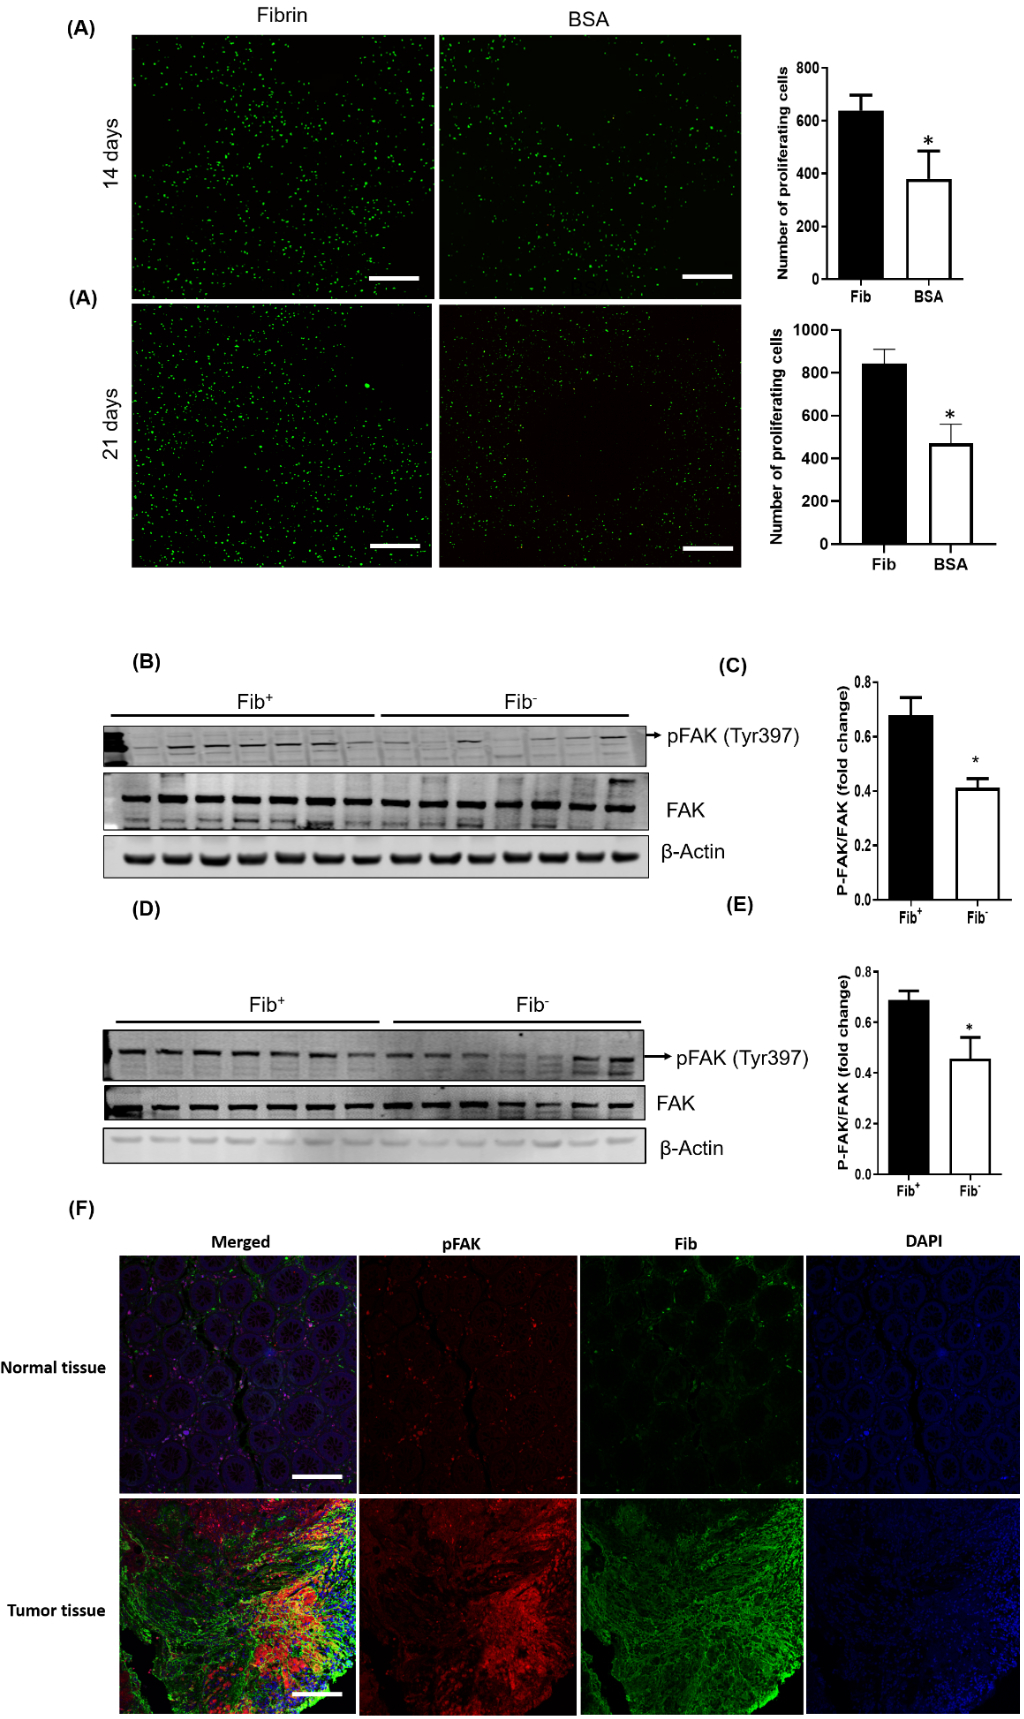
Figure 5. Fibrinogen in the colonic adenocarcinoma tumor stroma promotes FAK activation.

(A) Shown are typical examples of fluorescent micrographs of 3D bioprinted GFP-expressing MC38 tumor models generated using a CELLINK BioX printer (see Methods for details). Significantly greater cellular proliferation was observed after 14 and 21 days in the presence of fibrin versus a BSA control (n = 5 per cohort; *p < 0.05, Mann-Whitney U test). Scale bars represent 500 μm. (B) Western blot analyses for total FAK and pFAK(Tyr397) in MC38 tumor tissues harvested from Fib+ and Fib− mice 20 days after injection. (C) Mean protein levels calculated using densitometric analysis and expressed as a ratio of phospho- to total FAK in Fib+ and Fib− tumors. Beta actin was used as the internal control (n = 7 per cohort, *p < 0.05 Mann Whitney U test). Western blot (D) and densitometric analyses (E) for FAK and pFAK(Tyr397) tumor tissues harvested from Fib+ and Fib− mice 14 days after injection. (n = 7 per cohort, *p < 0.05 Mann Whitney U test) (F) Shown are representative biopsies of normal human colonic tissue and colorectal adenocarcinoma tissue immunofluorescently stained for fibrinogen (green) and pFAK (Tyr397) (red). Nuclei were counterstained with DAPI (blue). Note that areas of intense pFAK staining in colorectal adenocarcinoma samples colocalize with areas of intense fibrinogen staining. Also note that there is very little fibrinogen or pFAK staining in normal colonic tissues. Scale bars represent 100 μm.
