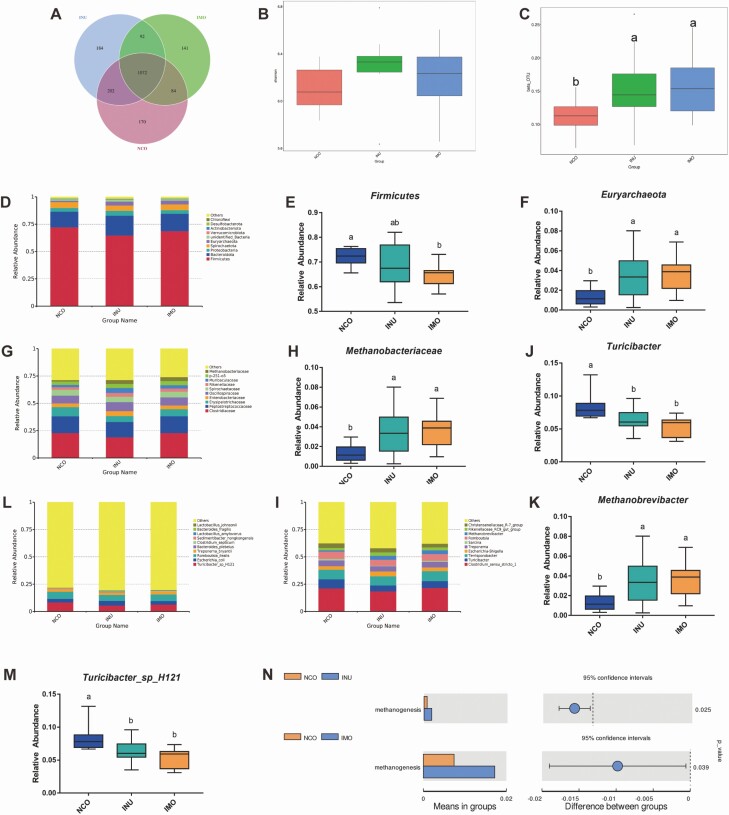
Figure 4.
Summary of the microbial community in the feces contents of sows. (A) Venn diagram summarizing the numbers of common and unique operational taxonomic units (OTUs) in the microflora community in the feces contents of sows. (B) Shannon index, reflecting species diversity within and between groups. (C) β-OTU index, reflecting species diversity within and between groups. (D–M) Top 10 taxa with differences in relative abundance between groups (phylum, family, genus, and species levels). (N) Tax4Fun function predictive analysis of inulin and isomalto-oligosaccharide on sow fecal flora.

