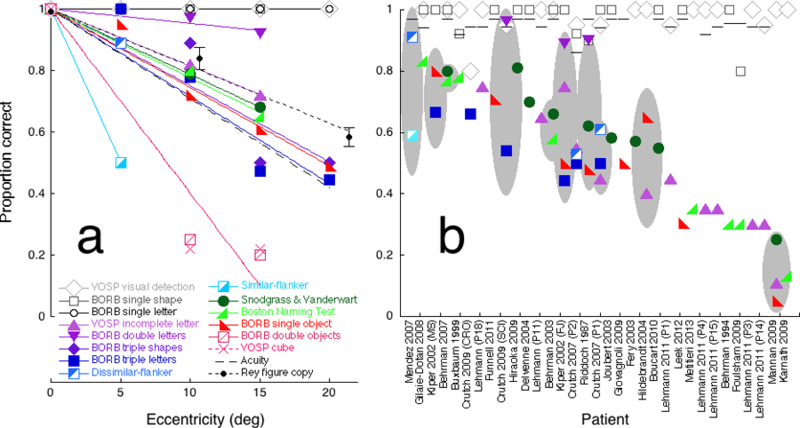
Figure 5. Raw performance of the eccentrically-viewing normal observer (a) and the patients (b).

(a) Performance by normal observer PMS of each test as a function of eccentricity. Performance p is proportion correct on each test except acuity and the Rey figure copy, for which we plot an acuity index pacuity (dashed line) and a copy index (solid black line). (b) Published proportion correct (or acuity index) of each patient (or group) for each test. There are 32 individual patients and one group. The group consists of fourteen Posterior Cortical Atrophy patients (Mendez et al., 2007). The horizontal scale lists each study’s first author and year of publication, sorted by mean performance on complex-display tasks. For each patient (or group), the grey ellipse indicates the 95% confidence interval for the mean across the complex-display tasks.
