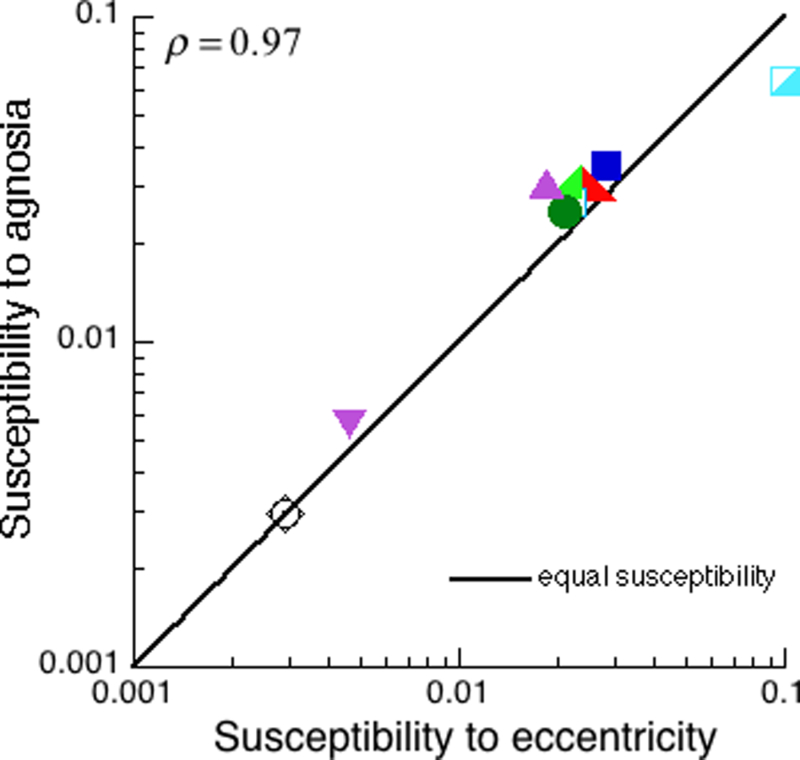
Figure 7. Susceptibility to agnosia vs. susceptibility to eccentricity.

These are the ten tests for which we have both eccentric and agnosic patients’ data. Each test is represented by a point in the scatter diagram of susceptibility to agnosia sa vs. susceptibility to eccentricity . Susceptibility to eccentricity was computed solely from the performance of the normal observer viewing at many eccentricities. Except for an overall scale factor, susceptibility to agnosia was computed solely from the performance of the many agnosic patients using central vision. The points are near the equality line, showing relative susceptibility of the tests is similar, whether we look across diverse agnosias or eccentricities. On these log scales, the correlation is 0.97, and the RMS deviation from equality is . Once again, the effect of agnosia on object recognition is like the effect of eccentricity.
