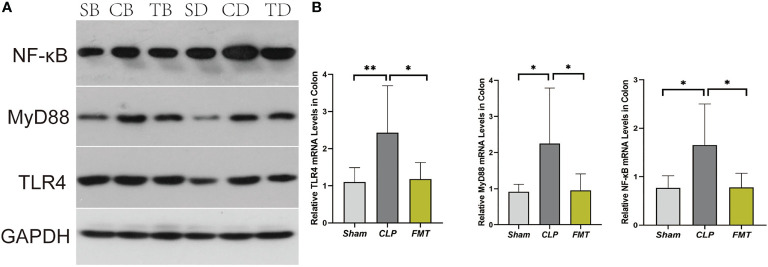
Figure 6.
TLR4, MyD88, and NF-κB expression and mRNA levels. (A) Expression of TLR4, MyD88, and NF-κB compared to GAPDH protein among Sham, CLP, and FMT groups at 24 and 48 h. SB, CB, TB, SD, CD, and TD represent 24 h Sham, CLP, and FMT groups and 48 h Sham, CLP, and FMT groups, respectively. (B) Relative TLR4, MyD88, and NF-κB levels in the colon. *P < 0.05, **P < 0.01.

