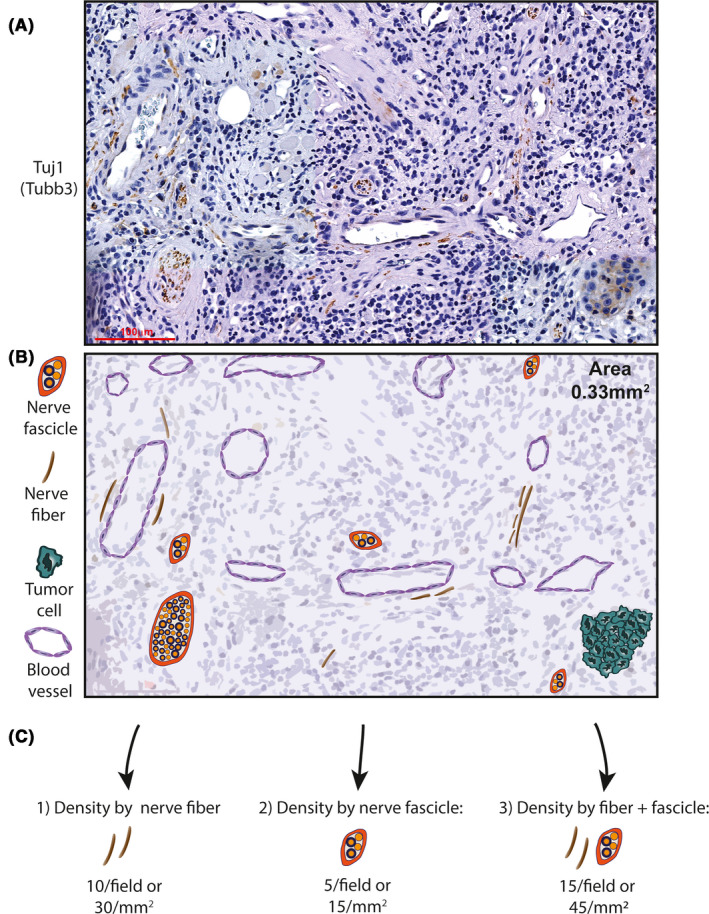
FIGURE 2.

Methods of quantification of nerve density. (A) Tuj1 immunohistochemistry stain in human oral cavity squamous cell carcinoma. (B) Schematic representation of A highlighting the different nerve structures present in the tissue (0.33 mm2 area of tissue, scale bar = 100 µm). (C) Different methods of nerve density assessment based on histologic observation; refer to Table 2 for references
