
FIGURE 2.
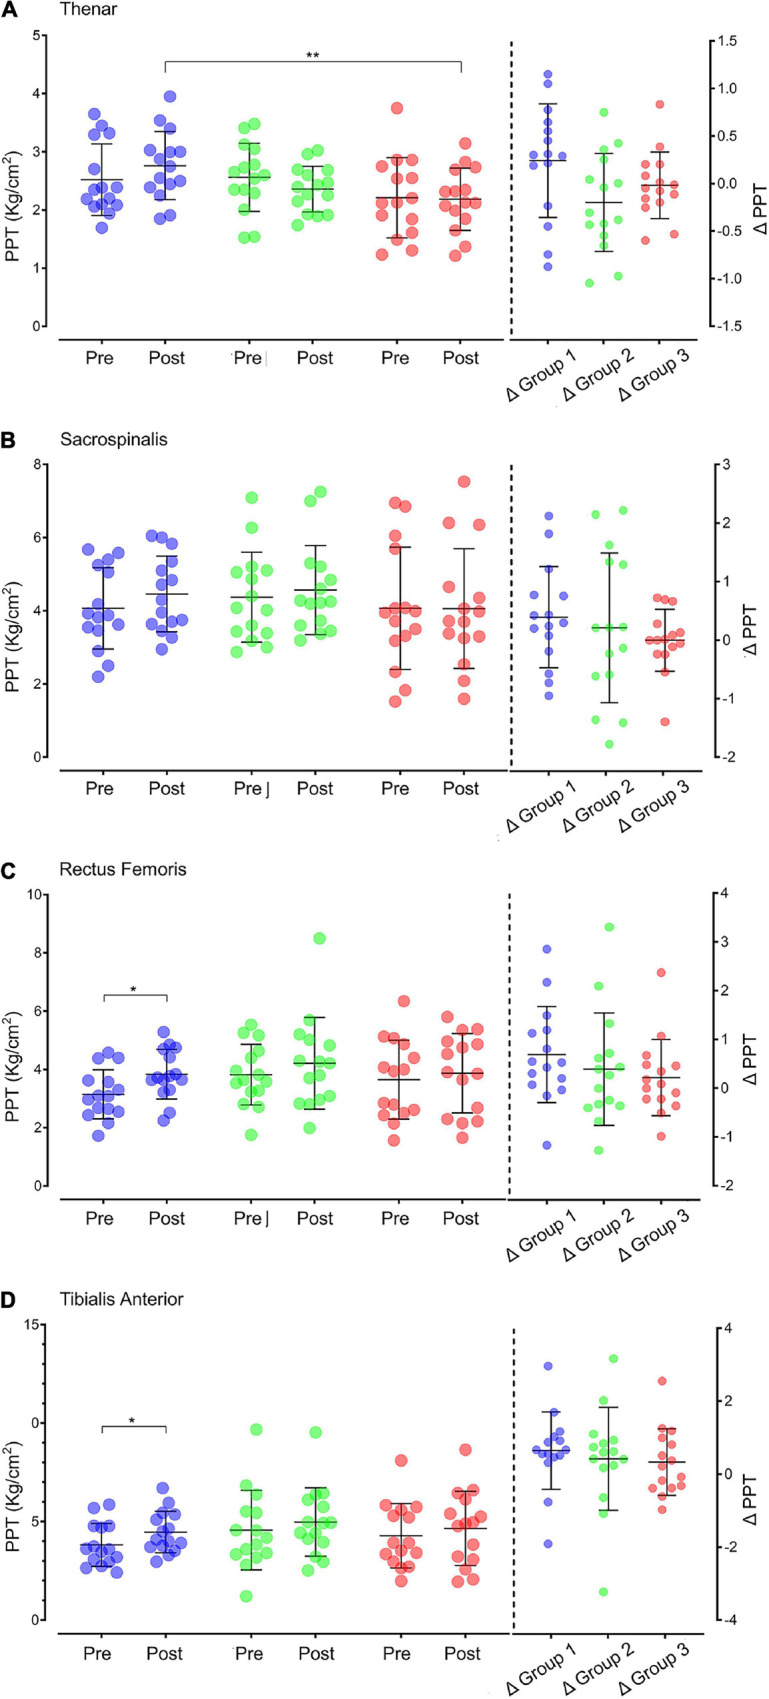
PPT in different sites before and after intervention in the three groups. (A) Thenar muscle PPT. (B) Sacrospinalis PPT. (C) Rectus femoris PPT. (D) Tibialis anterior PPT. On the left of the vertical dotted line are the PPT values before and after intervention of individuals (dots: purple for Group 1, green for Group 2, and red for Group 3) and groups (black line: X ± SD). The data on the right of the vertical dotted line are the individual (dot) and group (black line: X ± SD) values of the difference in PPT after intervention (△ = posttest–pretest). PPT: pressure pain threshold; Pre: pretest; Post: posttest. *p < 0.05; **p < 0.01.