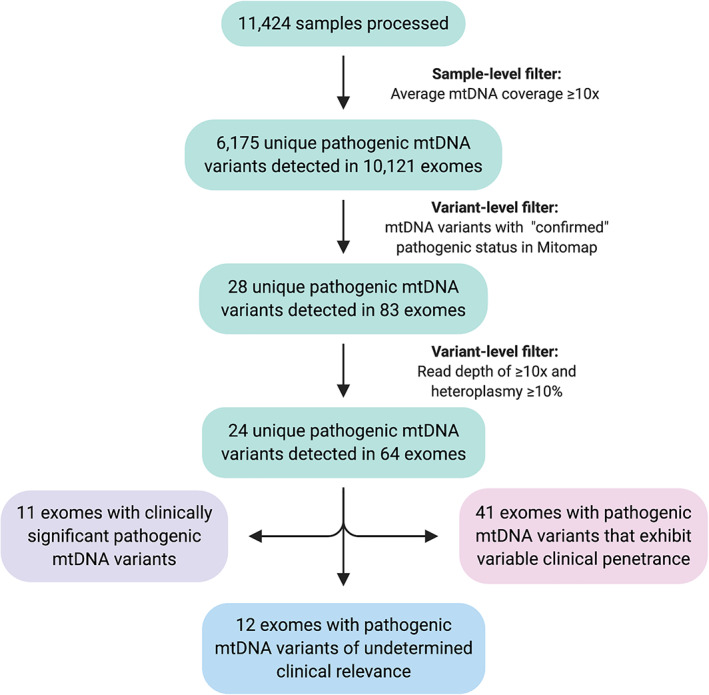
FIGURE 1.

Flow diagram summarizing sample‐level and variant‐level filtering steps applied to 11,424 samples that underwent exome sequencing analysis at the University College London Queen Square Genomics Facility between 2011 and 2019. The figure was created using BioRender.com. mtDNA, mitochondrial DNA. [Color figure can be viewed at www.annalsofneurology.org]
