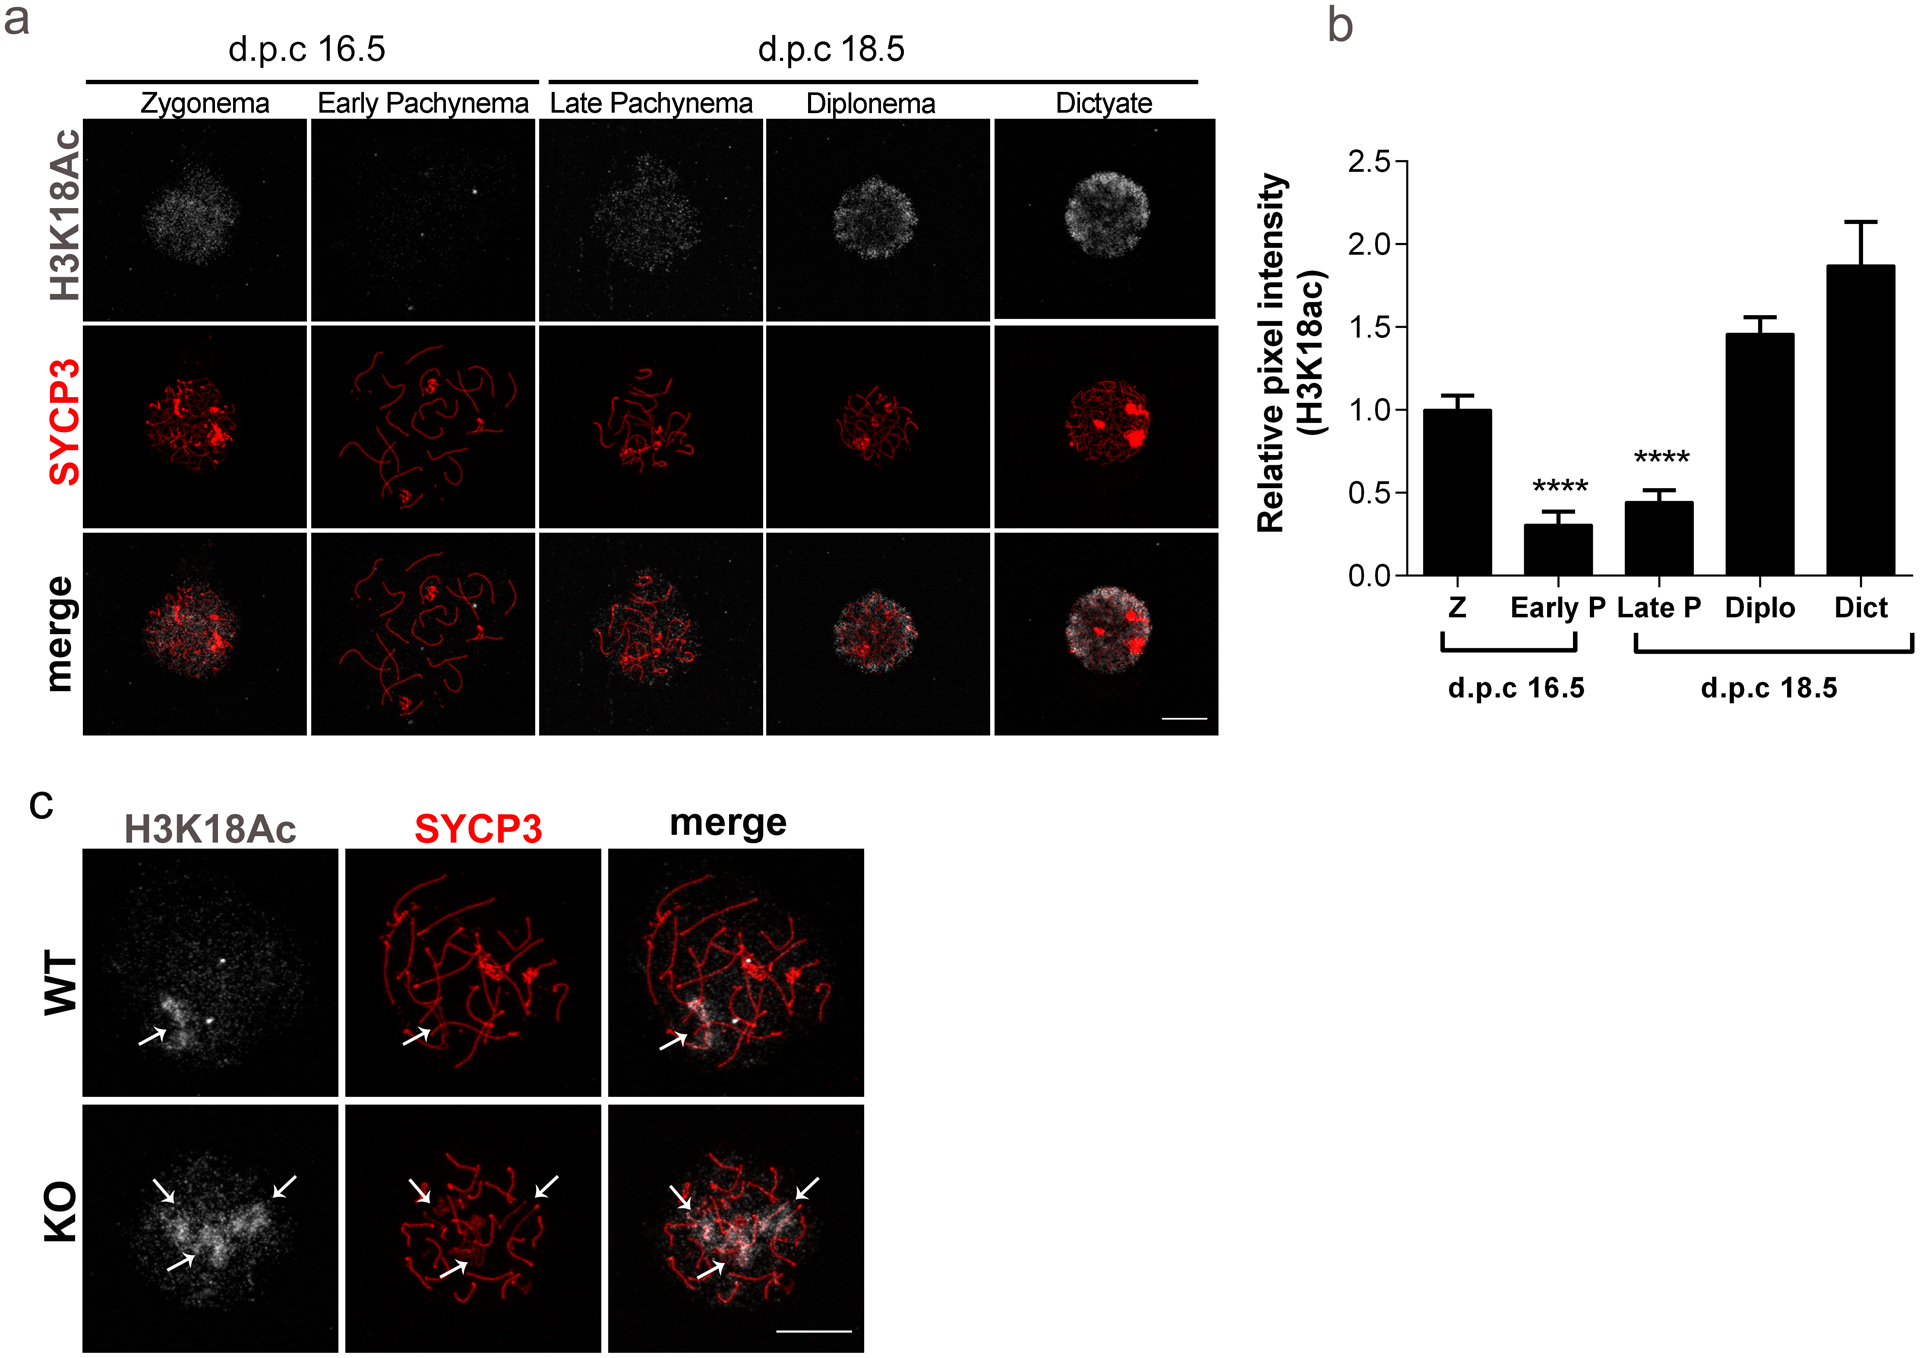
Fig. 8. Defects in deacetylation of H3K18 during pachytene correlates with regions of asynapsis.

(a) Representative images of prophase I substages in wild-type (WT) ovaries at embryonic days (d.p.c., days post coitum) 16.5 and 18.5, stained with an antibody to detect acetylated lysine 18 of histone H3 (H3K18ac) (gray) and SYCP3 (red). (b) H3K18ac pixel intensity as measured by the relative integrated density from prophase I substages represented in (a). Z, zygotene; P, pachytene; Diplo, diplotene; Dict, dictyate. Graph represents the mean ±SEM (n=3 experiments). (c) Representative confocal images detecting H3K18ac (gray) and SYCP3 (red) in pachytene-like oocytes from WT and Sirt7−/−(KO). ** P< 0.01; **** P< 0.0001. scale bar, 10μm
