. 2021 Sep 7;12(38):12827–12837. doi: 10.1039/d1sc03484g

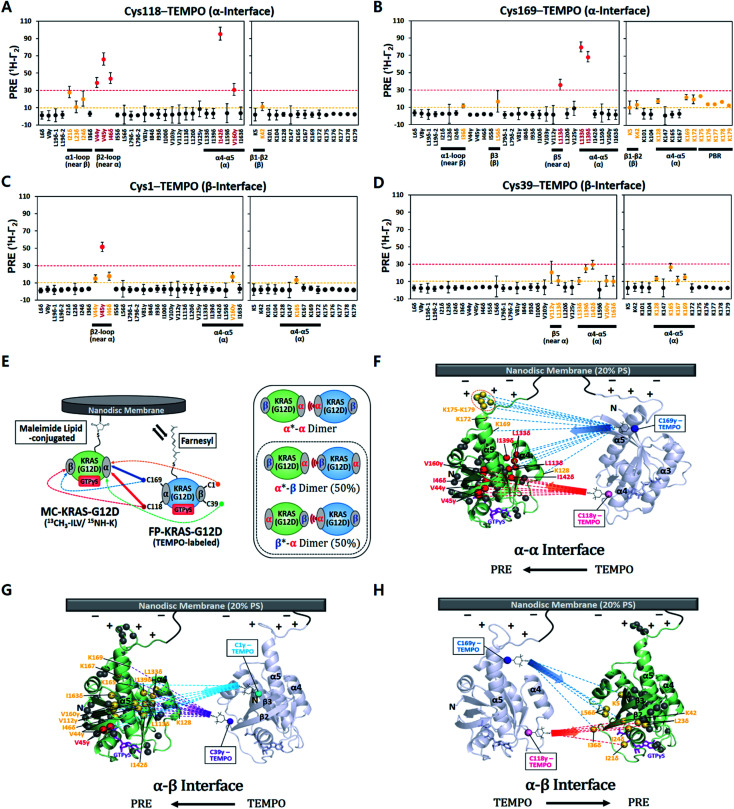
Fig. 1. Intermolecular protein–protein PRE effects between KRAS–G12D molecules on the membrane. (A–D) 1H-Γ2 PRE rates for ILV 13C-methyls and Lys 15N-amides of MC-KRAS–G12D in the presence of FP-KRAS–G12D tagged with TEMPO at Cys118 (A), Cys169 (B), Cys1 (C), or Cys39 (D). Probes are coloured according to the PRE exhibited; 1H-Γ2 values > 10 s−1 are moderate (yellow) and >30 s−1 are strong (red). PBR; polybasic region (K175–K179). (E) Schematic of PRE effects from spin labels attached to four sites on FP-KRAS–G12D on isotopically labelled MC-KRAS–G12D (left panel). Solid and dotted lines represent strong and moderate PRE, respectively. The right panel shows the possible molecular configurations of MC/FP KRAS–G12D dimers; green: isotopically labelled MC-KRAS–G12D; blue: spin labelled FP-KRAS–G12D. The isotopically labeled interfaces exhibiting PRE effects are indicated with an asterisk in each label. α*–β and β*–α dimers are equally likely to form. (F–H) Mapping KRAS–G12D protein:protein PRE effects. PRE-affected probes at the α*–α (F), α*–β (G), or α–β* (H) dimer interfaces mapped onto the crystal structure of GTPγS-bound KRAS–G12D (PDB ID: 4DSO) in an arbitrary dimerization model on a membrane containing 20% phosphatidylserine (PS) lipid. ILV 13C-methyl and Lys 15N-amide probes that exhibit moderate and strong PRE effects are colored as in panels A–D. Dotted lines represent the PRE effects that arise from TEMPO conjugated to Cys118 (red), Cys169 (blue), Cys1 (cyan), or Cys39 (purple) in the opposing protomer (arbitrarily positioned).

Fig. 1