. 2021 Sep 1;12(38):12711–12718. doi: 10.1039/d1sc04051k

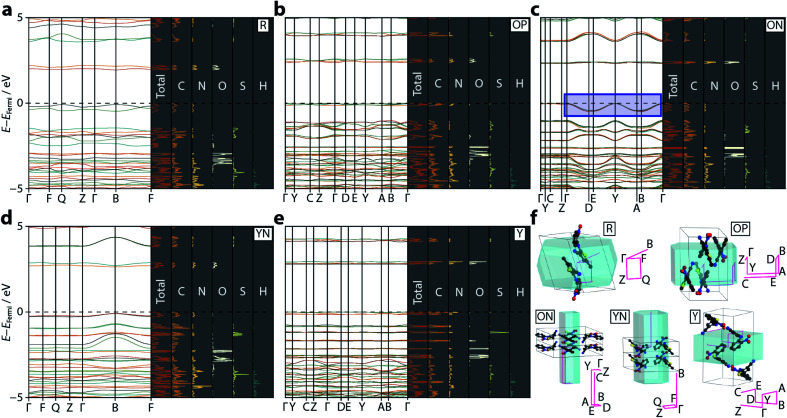
Fig. 3. Calculated electronic band structure diagrams for the ROY polymorphs: (a) R, (b) OP, (c) ON, (d) YN, and (e) Y. On each panel the left hand side shows the band dispersion for the relevant k-point paths through the Brillouin zone. The right hand, shaded, panels show the total PDOS, along with the individual atom contributions. The dotted black line shows the Fermi level, set to 0 eV in each case (absolute EFermi values are: R = −5.49, OP = −5.80, ON = −5.73, YN = −6.00, Y = −6.04 eV). The blue rectangular region in (c) highlights the anomalous energy dispersion in the valence bands for ON. (f) A visualisation of the Brillouin zone paths (pink) in each polymorph, compared with the real-space unit cells. Each sampled k-point is labelled. Hydrogen atoms are omitted for clarity.

Fig. 3