. 2021 Sep 1;12(38):12711–12718. doi: 10.1039/d1sc04051k

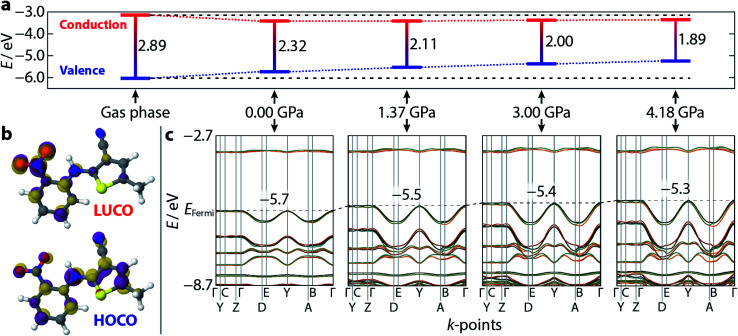
Fig. 4. Calculated electronic band structure and orbital diagrams for ON–ROY as a function of pressure. (a) The calculated Γ-point band gap, at each pressure, and the absolute values of the valence (blue) and conduction (red) bands. A gas phase (isolated molecule) calculation is shown for reference. The horizontal black dotted lines are extrapolated from the gas phase structure for reference. (b) A visualisation of the lowest unoccupied, and highest occupied, crystalline orbitals (LUCO/HOCO) at ambient pressure—the isosurface value is 0.05 eV Å−2. The purple/gold colours of each individual orbital simply indicate opposite signs of the wavefunction. (c) The band structure for each crystalline model, corresponding to the band gaps shown in (a). The increasing extent of band dispersion with applied pressure is particularly evident at the top of the valence band. The black dotted line indicates the energy of the Fermi level (positioned at the centre of the y-axis at 0.0 GPa), which increases with pressure—its value is shown, inset, on each plot.

Fig. 4