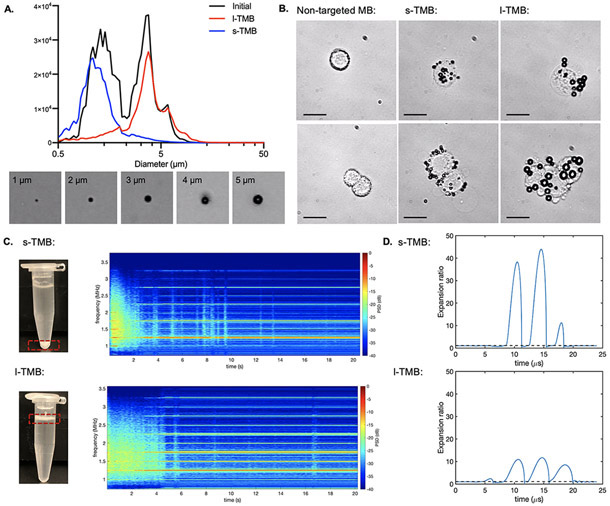
Figure 2.
A) Diameter distribution for pre-segmented TMBs, s-TMBs and l-TMBs, and representative images for 1, 2, 3, 4 and 5 μm TMBs under optical microscopy. B) Representative optical images of s-TMBs and l-TMBs adherent to cells and cell clusters. Scale bar: 30 μm. C) Spectrogram of the received signals from PCD as a function of time for s-TMBs and l-TMBs. D) Expansion ratio as a function of time for s-TMB (diameter= 1 μm) and l-TMB (diameter = 4 μm) simulated by using the Marmottant model.

