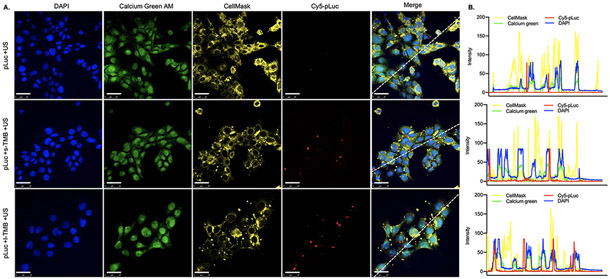
Figure 3.
A) Confocal laser microscopy images of cellular distribution of Cy5-pLuc after sonoporation with no TMB (top panel), s-TMBs (middle) and l-TMBs (bottom). Scale bars: 25 μm. B) Fluorescence intensities for each channel were quantified based on the dashed line in the microscopic images in Figure 3A.

